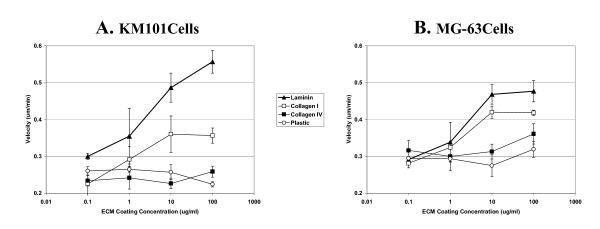
Figure 5.
Velocity dose-response. Velocity measurements for single cells were averaged over the time period from 24 to 48 hours and were normalized based upon the average velocity of cells on mock-coated plastic in each of three experiments (see Methods). Velocities are plotted versus the coating concentration of the extracellular matrices laminin (triangles), collagen I (open squares), collagen IV (closed squares), and mock-coated plastic (open circles) for KM101 cells (A) and MG-63 cells (B). Error bars indicate the standard error for three experiments. Identical mock-coated plastic controls were included for each concentration; in this case, since the concentration values for plastic are bogus, these results illustrate random variation for the replicate means.

