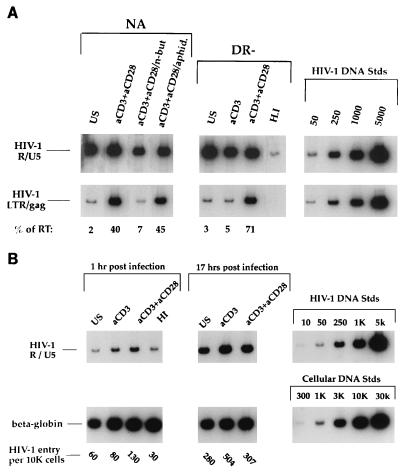
FIG. 5.
(A) HIV-1 reverse transcription following various stimulation treatments. Cells under the conditions described in the legends to Fig. 2 and 3 were infected with the CXCR4-tropic HIV-1 molecular clone NL4-3. At 17 h postinfection, DNA was harvested and subjected to a quantitative PCR. The primer pairs M667/AA55 (R/U5) and M667/M661 (LTR/gag) were used to detect initiation and completion of the HIV-1 reverse transcription process, respectively, in equivalent amounts of infected cell DNA. Copy numbers were determined by comparison of samples under each condition to the appropriate standard curve by utilizing radioanalytic image analysis. Percentages of initiated reverse transcripts that completed the reverse transcription process (% of RT) were determined by utilizing the following formula: %RT = (completed DNA copies/ initiated DNA copies) × 100; these values are indicated for each of the conditions. Data are representative of seven experiments and are derived from the same cells as those represented in Fig. 2 and 3. (B) HIV DNA is due to de novo reverse transcription. Highly purified DR− cells were left unstimulated, were stimulated with anti-CD3 alone, or were costimulated with anti-CD3 and anti-CD28 for 3 days. Cells were infected as described in the legend to Fig. 5A and harvested and subjected to quantitative PCR at 1 and 17 h postinfection. The number of HIV-1 entry sequences per 104 cells was calculated based on total cell genomes assessed, as determined by quantitative PCR for human β-globin DNA sequences, and is indicated for each of the conditions. Standards for both HIV and cell DNAs that were amplified in parallel are shown on the right (K, thousand). US, unstimulated; aCD3, stimulated with anti-CD3 alone; aCD3+aCD28, costimulated with anti-CD3 and anti-CD28.

