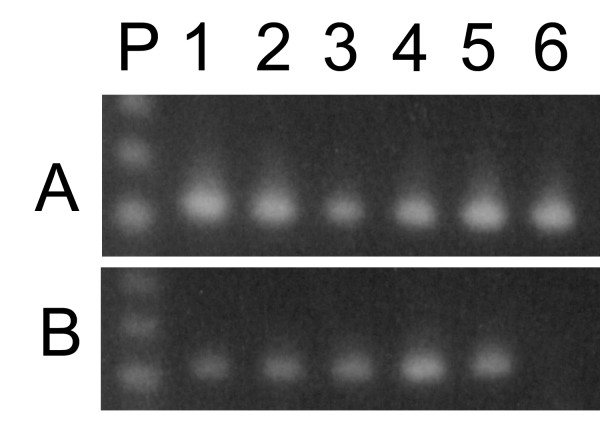
Figure 4.
Abundance of ACT1 transcripts during growth of Saccharomyces cerevisiae in glucose. RT-PCR amplicons were generated by 30 reactions cycles using ACT1 primers and 1.0 μg of RNA. Ten micro liters of each reaction were electrophoresed on a 1.3% agarose gel and stained with EtBr. Total RNA was isolated from Saccharomyces cerevisiae cells grown in YPD-supplemented medium and harvested at 0.7 mg (dry weight)/ml (lane 1); 1.2 mg (dry weight)/ml (lane 2); 2.1 mg (dry weight)/ml (lane 3); 2.6 mg (dry weight)/ml (lane 4); 3.2 mg (dry weight)/ml (lane 5) and 7.0 mg (dry weight)/ml (lane 6). P, 123 bp DNA Ladder (BioLabs -Inc). A – Untreated RNA; B – RNA treated with Danes I by protocol I

