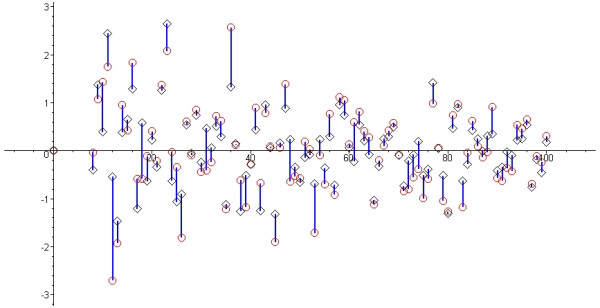
Figure 2.

Actual pooled mean difference and estimated pooled mean difference. The black diamonds represent the actual pooled mean difference using sample means. The red circles represent the pooled mean differences for the same samples using our estimation formulas (we connected the corresponding symbols for clarity). The horizontal axis represents the number of trials in the meta-analysis (from 8 to 100).
