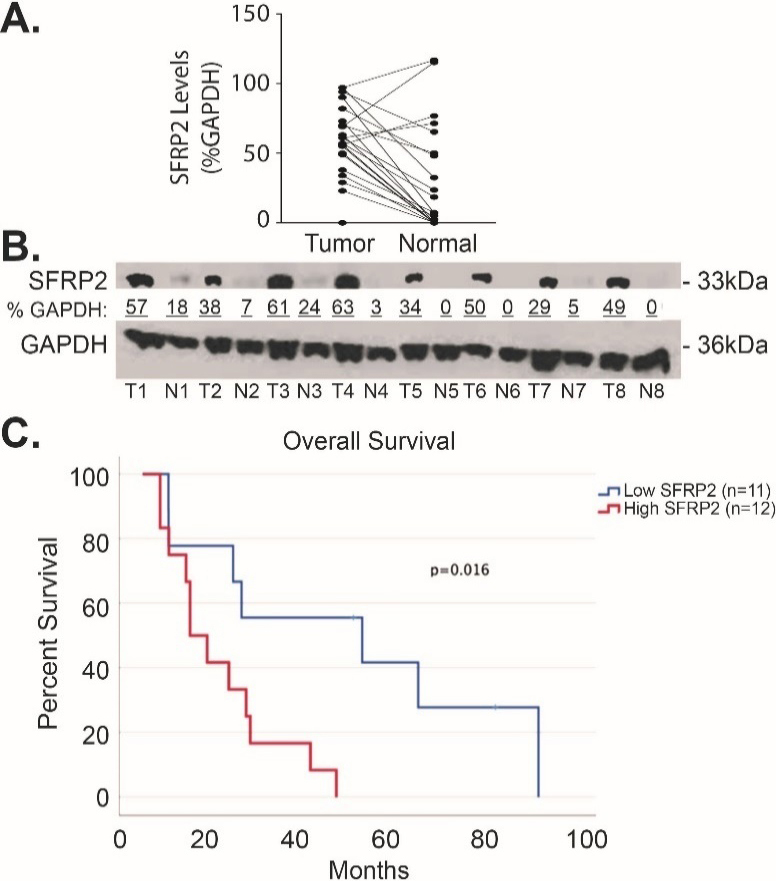
Figure 3.

SFRP2 protein expression is increased in pancreatic cancer. (A) Blot plot of the densitometry values from representative western blot comparing the levels of SFRP2 between tumor tissue from patients in Table 1 and their normal adjacent pancreatic tissue. (B) Representative western blot of tumor tissues (T) and their normal adjacent tissues (N). Densitometry was calculated by measuring the total intensity of each SFRP2 band in tumor and normal samples, and comparing them to the loading control, GAPDH.
