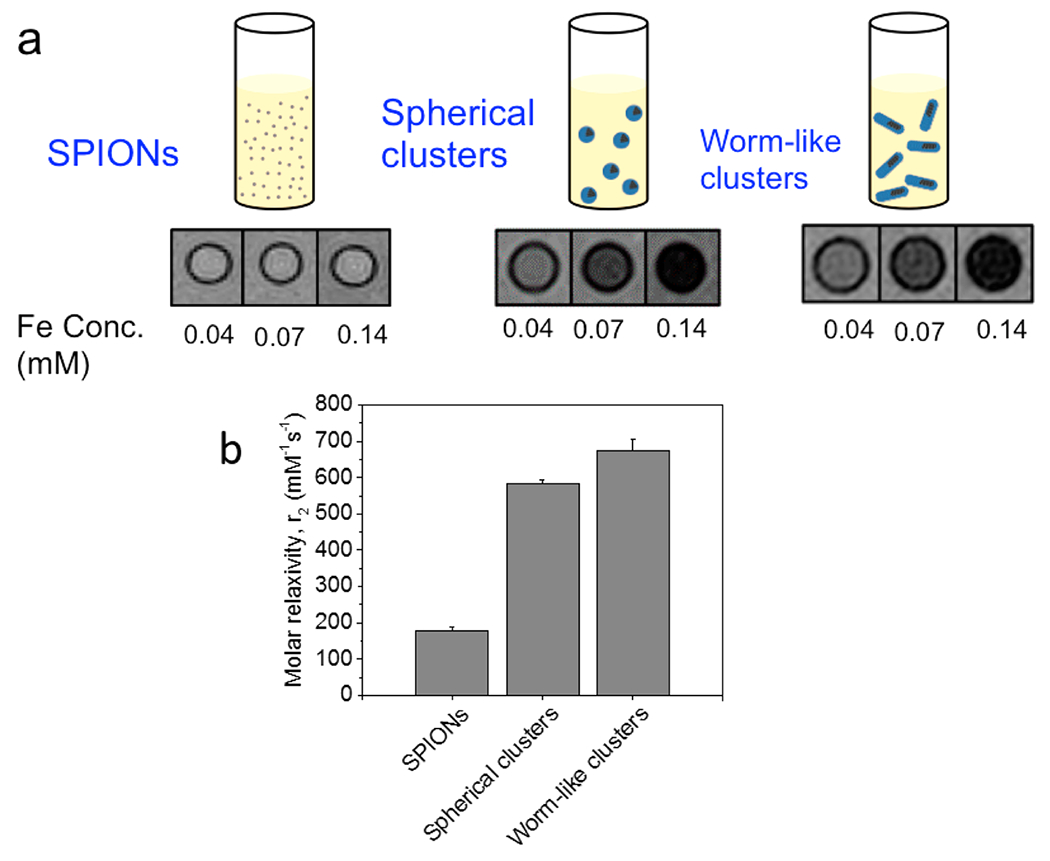
Figure 3.

Analysis of MR relaxivity of SPION clusters. (a) MR images of the phantom model prepared with SPIONs, spherical clusters, and worm-like clusters dispersed in water. (b) MR relaxivity of SPION clusters. The T2 molar relaxivity of worm-like clusters was slightly higher than that of spherical clusters; however, resultant differences in contrast capability at given Fe concentrations were minimal. Error bars represent standard deviation of the fit parameter.
