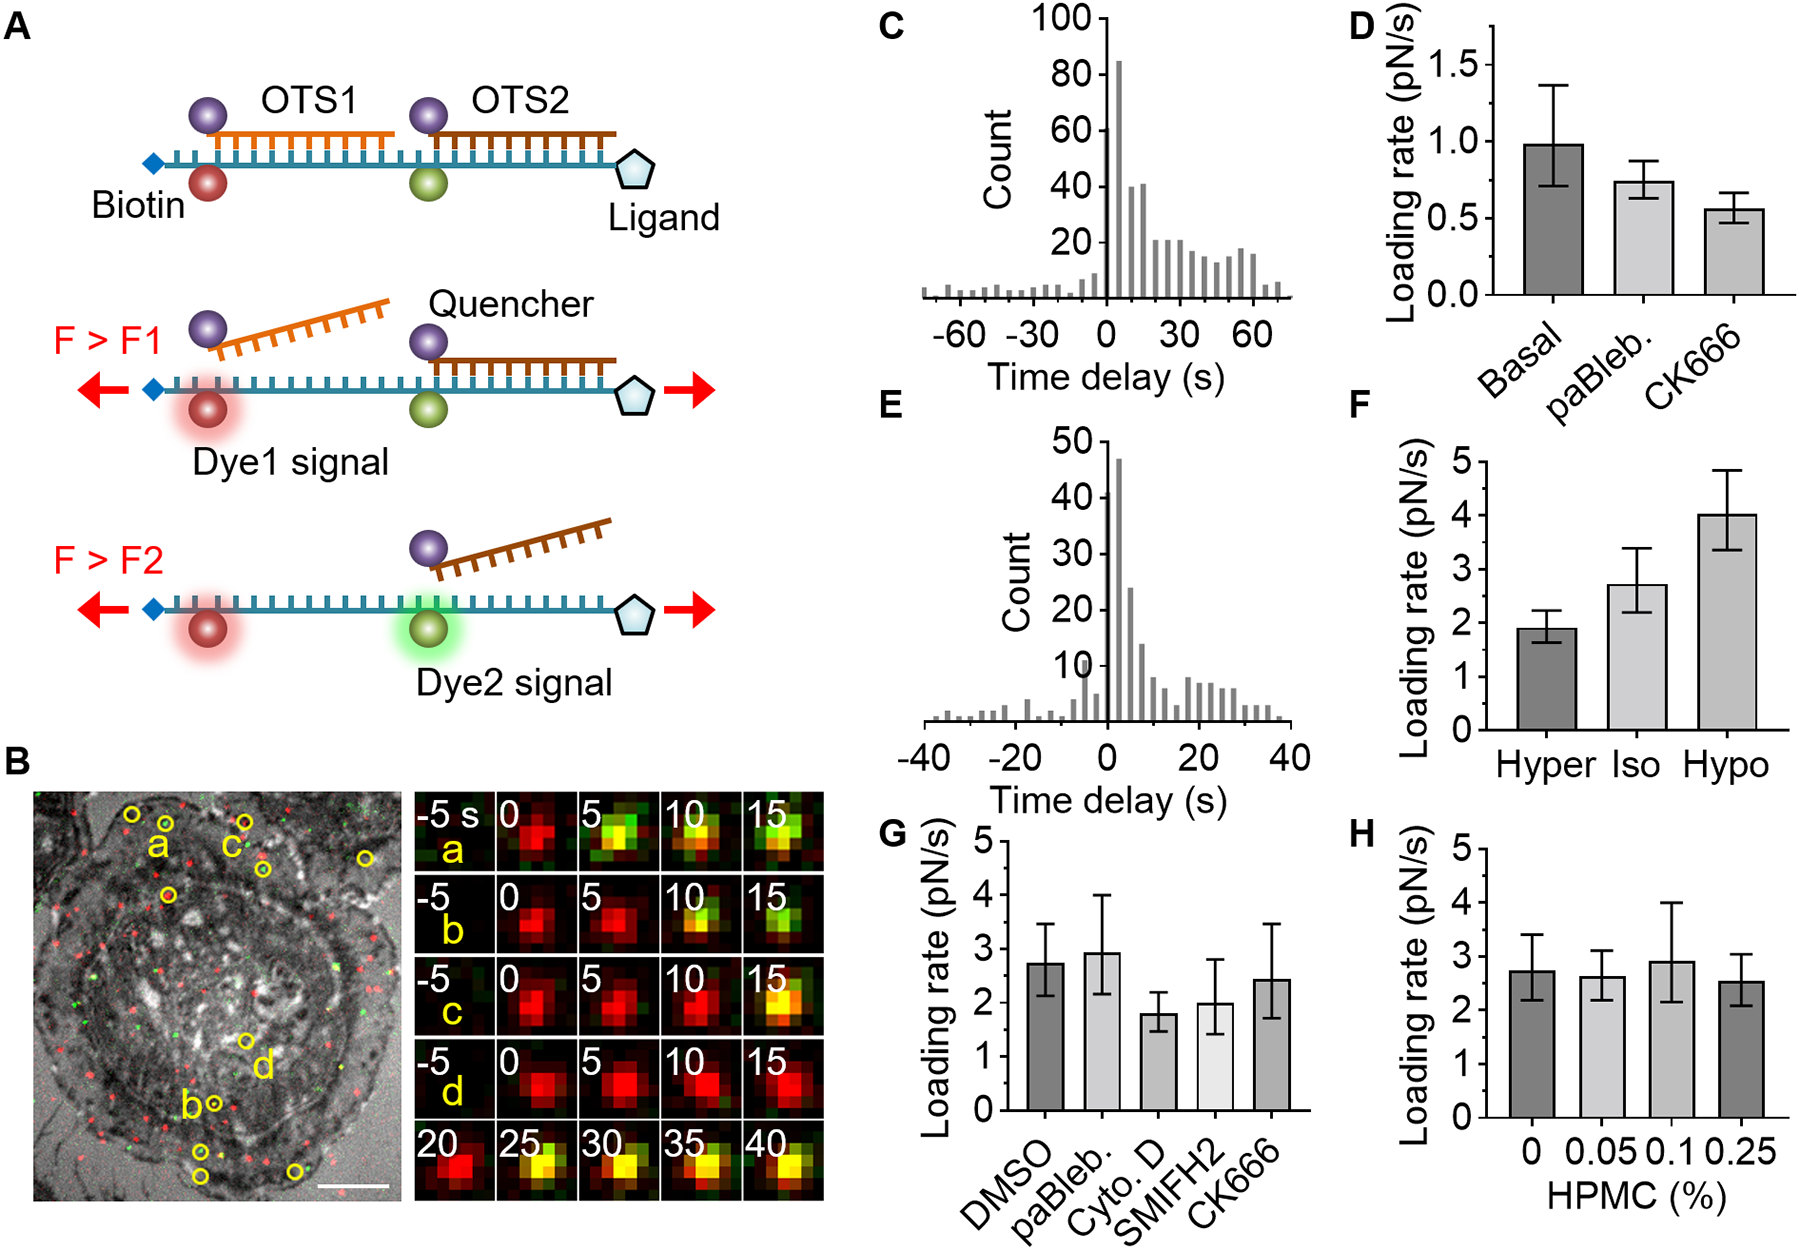
Fig. 4. Cellular force loading rate measurement using serially connected OTS.

A serially connected OTS detects two levels of force, enabling loading rate measurement. (A) Schematic of two-level force detection using OTS. (B-D) RGD-binding integrin force in epithelial cells (U2-OS). The ligand used is cRGDfK. (B) Two OTS signals (red for dp16-Atto647N and green for dp30-Cy3) are overlaid on the ventral surface image (RICM). Colocalized signals were marked in yellow circles (Atto647N and Cy3). Time-lapse images of the spots are shown. Scale bars, 10 μm. (C) Histogram of time delay between dp16 and dp30 signals (5 s interval). (D) Effect of cytoskeletal inhibitors on loading rate in U2-OS cells: para-amino-Blebbistatin (10 μM) or CK666 (50 μM). (E-H) Integrin α4β1 force in monocyte (THP-1) was measured using LDVP. (E) Histogram of measured time delay in basal condition (2.5 s interval). (F) Loading rate in a hypertonic, isotonic, or hypotonic medium. (G) Loading rate with DMSO (0.02%) or a cytoskeletal inhibitor: para-amino-Blebbistatin (10 μM), Cytochalasin D (0.5 μM), SMIFH2 (1 μM), or CK666 (10 μM). (H) Viscosity effect on loading rate. Hydroxypropyl methylcellulose was added. Data is combined from three independent experiments. Data and error bars indicate the result of single-exponential fitting and 90% confidence intervals (D, F-H). See fig. S7 for additional information.
