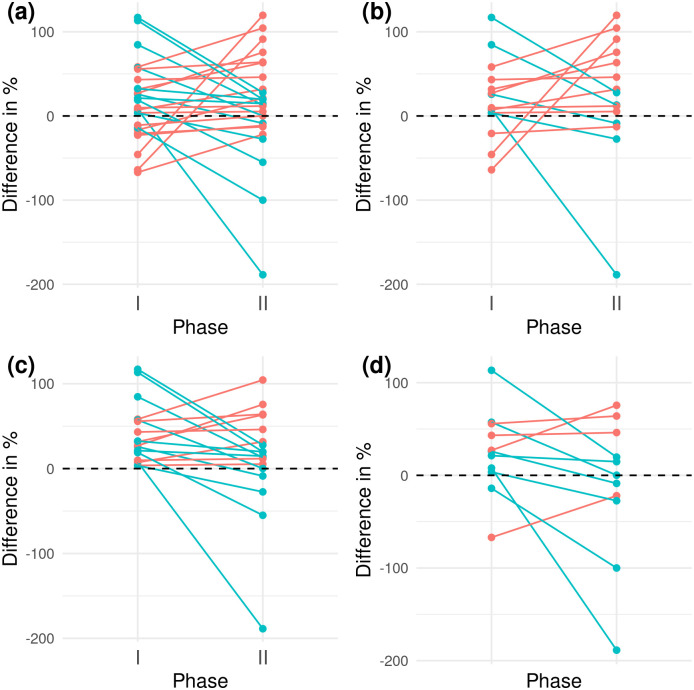
Fig 1. Difference in % between the estimated and true effects (represented as relative under- or overestimation) in phases 1 and 2.
(a) Full sample (n = 26); (b) students with higher grades (n = 15); (c) students who overestimated the true effect in phase 1 (n = 18); (d) female students (n = 11). Connected points represent the values for phases 1 and 2 for each student. Red lines indicate an increased estimated effect size in phase 2 compared to phase 1, and blue lines indicate the reverse.

