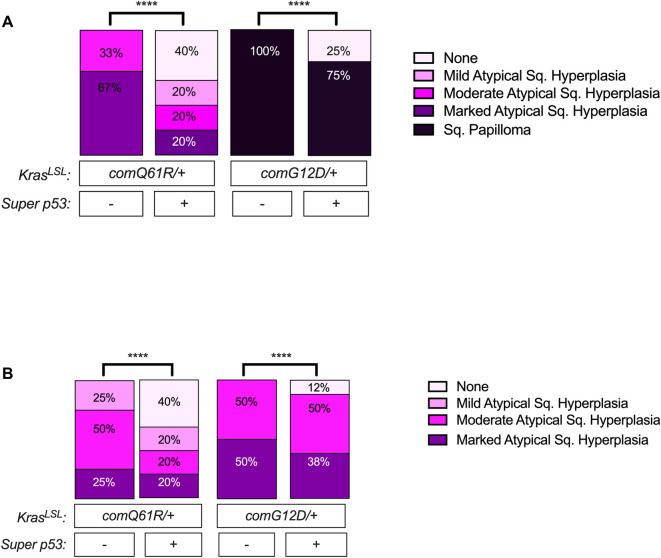
Fig 2. The effect of p53 dosage on Kras-driven oral and forestomach tumorigenesis.
Percentage of Rosa26CreERT2/+ mice of the indicated genotypes (n = 5–8) with the indicated grades of (A) oral and (B) forestomach squamous epithelial lesions at moribundity endpoint. Pairwise comparisons of severity of oral and forestomach lesions in each genotype with versus without Super p53 were performed using Chi-square test. ****: p-value <0.0001. Oral and forestomach squamous epithelial lesion incidence and grading data values are provided in S3 Appendix.

