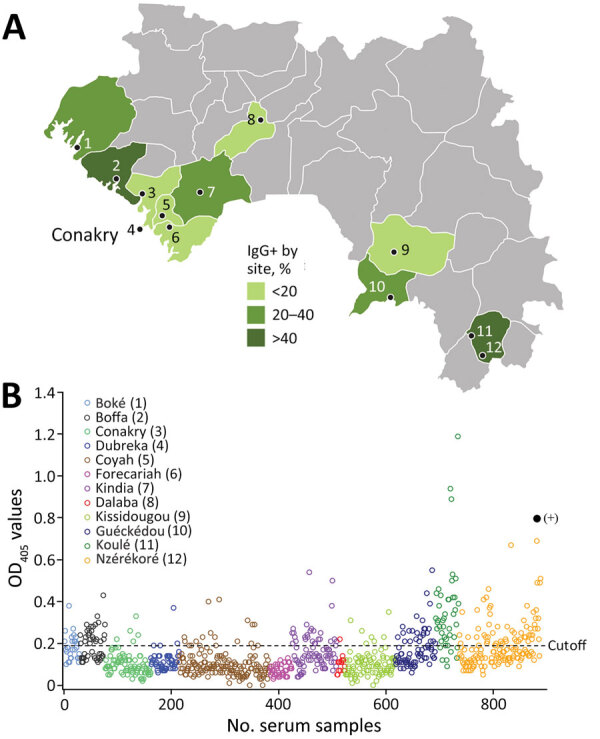
Figure 3.

Disparity in seroreactivity to Zaire Ebola virus (EBOV) in pig farming regions, Guinea, 2017–2019. A) Spatial distribution of seroreactivity: lower class, 0%–20% seroreactivity; middle class, 20%–40% seroreactivity; and higher class, >40% seroreactivity. Numbers on map and in panel B key indicate testing sites: 1, Boké; 2, Boffa; 3, Dubreka; 4, Conakry; 5, Coyah; 6, Forecariah; 7, Kindia; 8, Dalaba; 9, Kissidougou; 10, Guéckédou; 11, Koulé; 12, Nzérékoré. B) Plot distribution of OD values of the 888 serum samples tested by ELISA against EBOV nucleoprotein. Solid black circle at right top represents the OD value of the serum from a pig immunized with EBOV-like particles (OD 0.8). Dashed line represents the cutoff value of the assay (0.19). OD, optical density.
