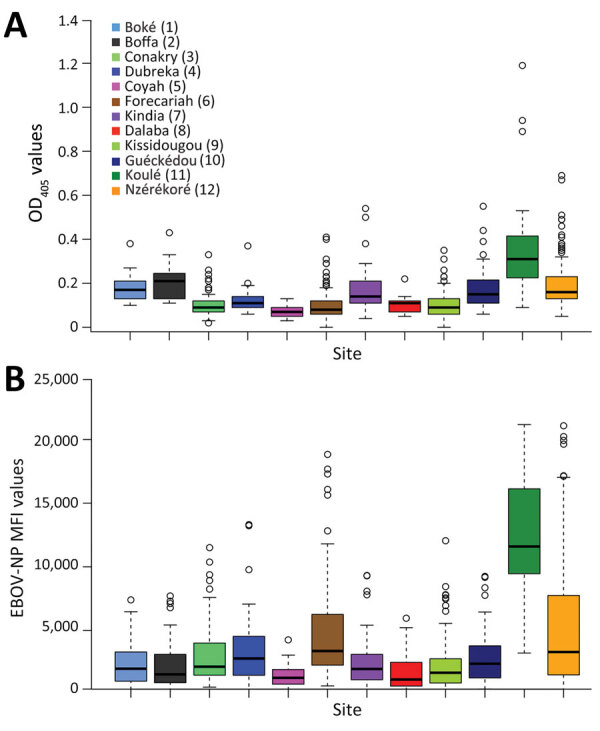
Figure 4.

Comparison between results of indirect ELISA and multiplex microsphere immunoassay for EBOV-NP in study of geographic disparity in domestic pig population exposure to Ebola viruses, Guinea, 2017–2019. A) Boxplot of OD values at 405 nm (OD405) obtained by ELISA by site (n = 888 pig serum samples). B) Boxplot of MFI values obtained by multiplex microsphere immunoassay (n = 882 pig serum samples). Locations in key correspond to locations on map in Figure 3. EBOV, Zaire Ebola virus; MFI, mean fluorescence intensities; NP, nucleoprotein; OD, optical density.
