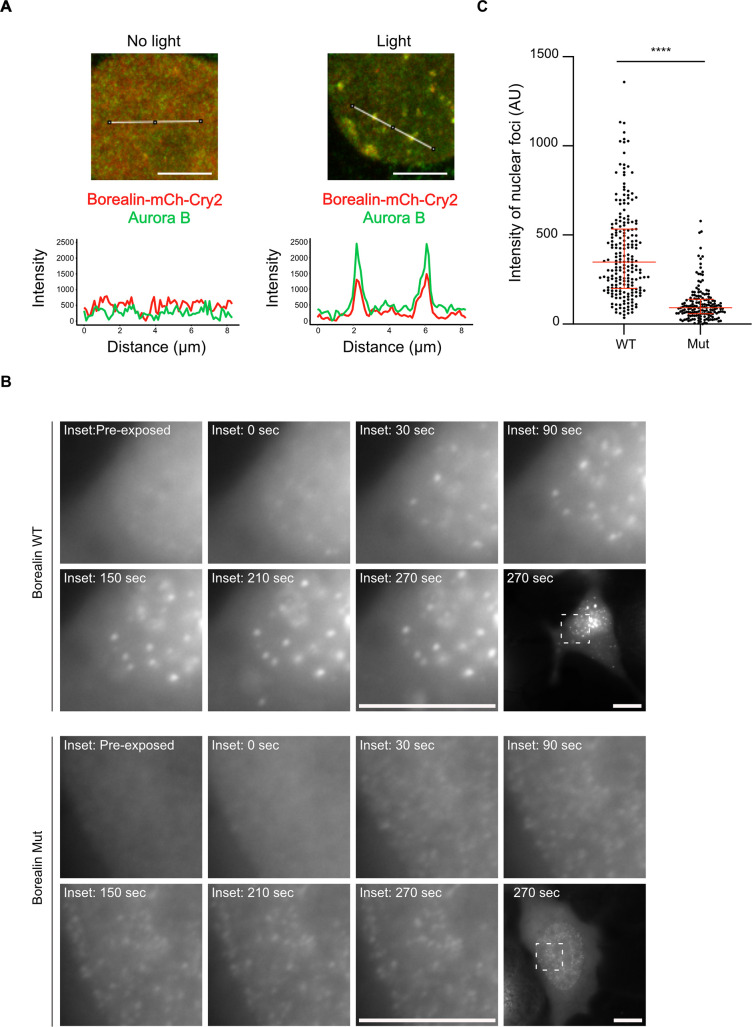
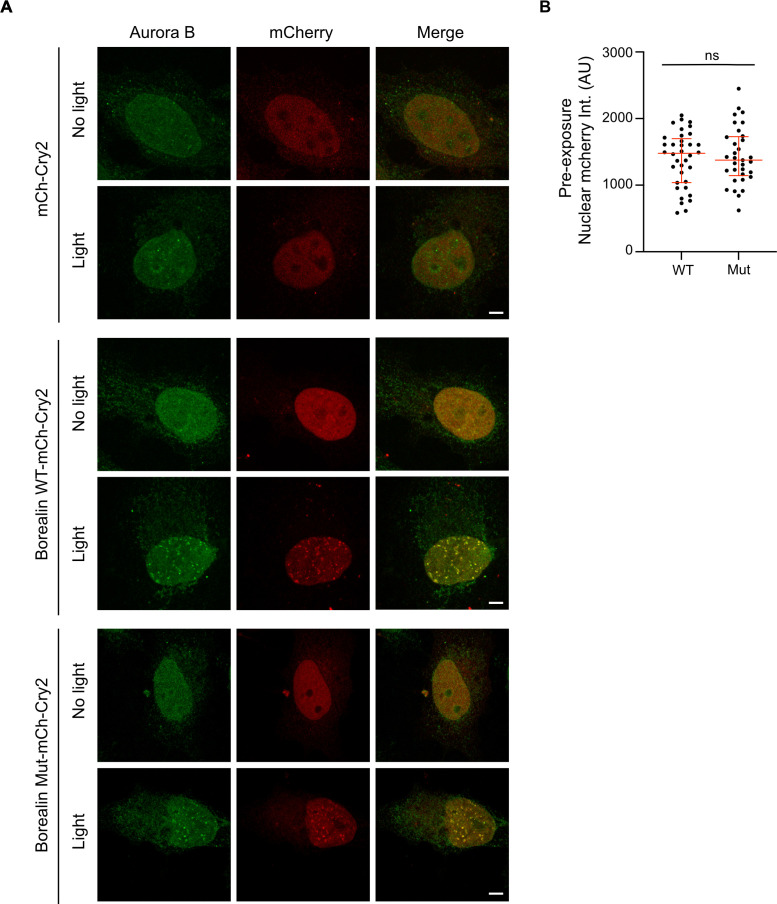
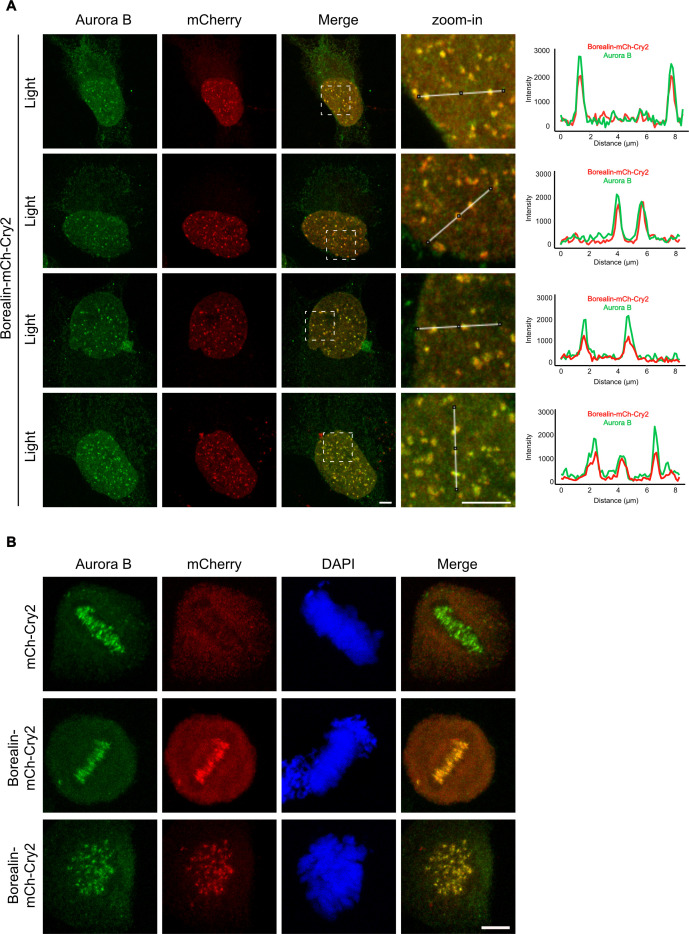
Figure 6. Disrupting salt-bridge residues in Borealin diminishes phase separation in cells.
(A) Endogenous Aurora B is recruited to nuclear Borealin foci upon exposure to 488 nm light. Images within the nucleus are shown (see Figure 6—figure supplement 1 for images of the entire cell for each of these enlarged views). The positions of the line scans (below) are indicated in the images by a white line. Scale bar = 5 μm. (B) Fluorescent detection of BorealinWT or BorealinMut, each fused to mCherry-Cry2 in an optoDroplet assay. Images were collected before and after (at the indicated timepoints) exposure to 488 nm light to induce Cry2 dimerization (note that the images were acquired with the same imaging conditions and scaled in the same manner for display). Scale bar = 10 μm. (C) Quantification of the intensity of foci. n=2 experiments, and 18 (WT) and 16 (Mut) cells. The results of an unpaired, non-parametric t-test, Mann-Whitney test is shown, wherein **** equates to a p-value <0.0001. The lines represent the median and the interquartile range.


