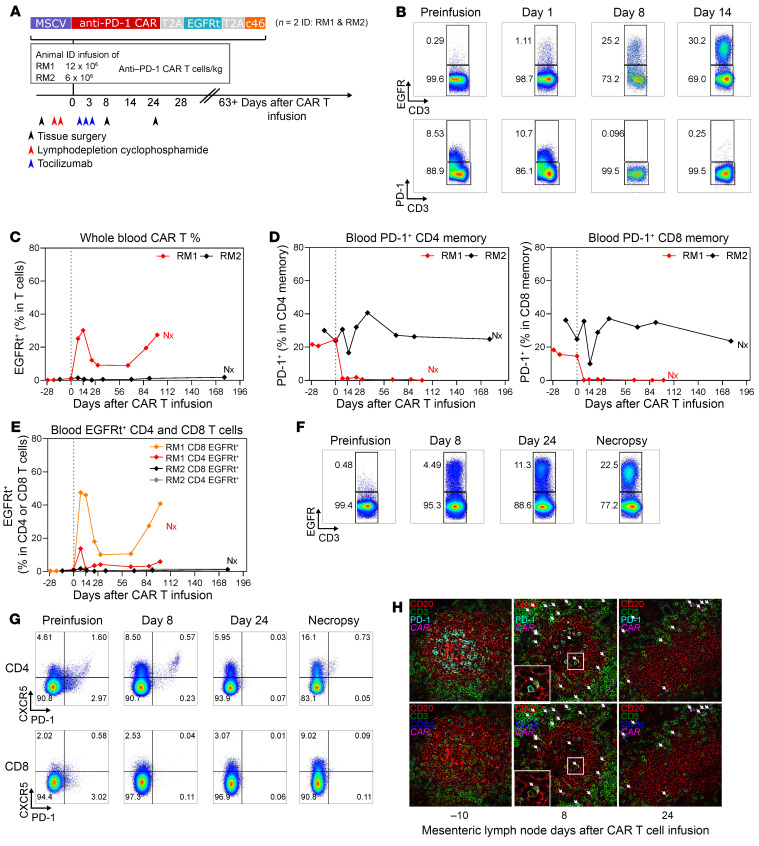
Figure 3. Anti–PD-1 CAR T cells expand in vivo and deplete PD-1+ CD4+ and CD8+ T cells in an SIV-naive RM.
Schematic of the in vivo animal study in SIV-naive RMs (n = 2). Dates for tissue surgery, lymphodepletion, and tocilizumab treatment are noted (A). EGFRt and PD-1 cell marking in total CD3+ T cells in vivo at days 8 and 14 indicates robust expansion of anti-PD1 CAR T cells in RM1 (B). Longitudinal PBMC sampling in RM1 and RM2 for percentages of total CAR T cells in CD3+ T cells (C) and PD-1+ in CD4+ and CD8+ T cells (D). Nx, necropsy. Flow cytometric analysis of EGFR+ CD4+ or CD8+ CAR T cells in peripheral blood in RM1 (E). Expansion of CAR T cells in Peri.LN of RM1 (F). Depletion of PD-1–expressing TFH cells in LNs was assessed by flow cytometry (G). Combined multicolor IHC and RNA FISH for CD3 (green), CD20 (red), PD-1, CD8α RNA (blue), and CAR RNA (cyan) on B cell follicles of mes.LNs on days –10, 8, and 24 relative to infusion. White arrows indicate the location of anti–PD-1 CAR CD8+ T cells (H). Original magnification, ×40.

