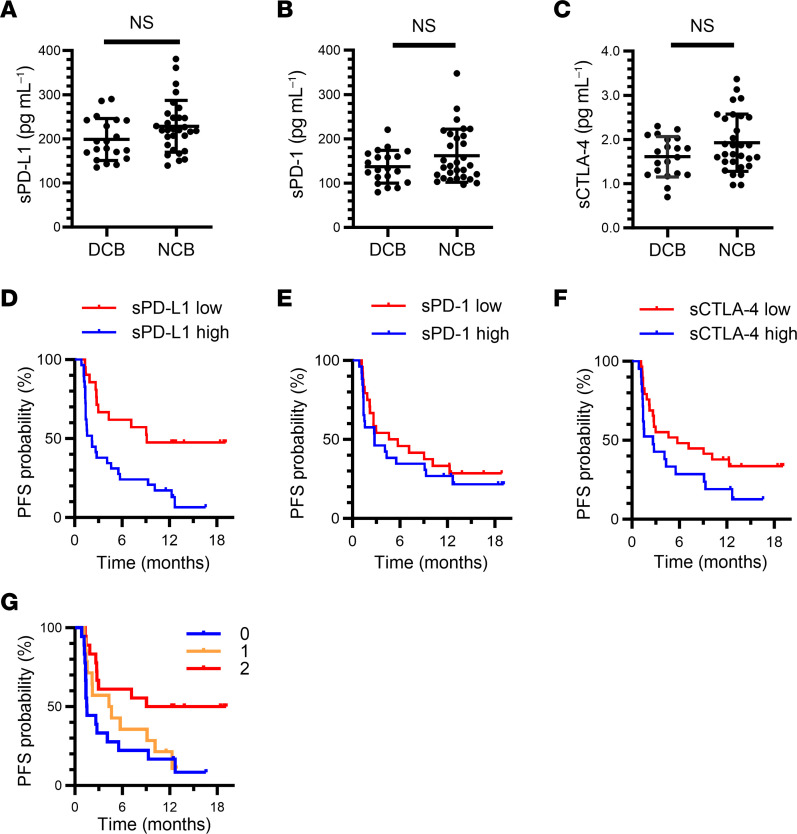
Figure 2. Combination of circulating soluble immune factors allows stratification of patients with advanced NSCLC in the Nivolution trial according to responsiveness to nivolumab.
(A–C) Comparison of pretreatment plasma concentrations of sPD-L1 (A), sPD-1 (B), and sCTLA-4 (C) between patients with a DCB (n = 20) or NCB (n = 30). Mean ± SD values are indicated; Mann-Whitney U test. (D–F) Kaplan-Meier curves for PFS of patients with high or low concentrations of each soluble immune factor based on the determined cutoff values. For D, the sPD-L1 cutoff was 205 pg/mL (high, n = 29; low, n = 21), and the median PFS was 9.1 versus 2.2 months for low and high sPD-L1, respectively (log-rank P = 0.002), with an HR of 0.35 (95% CI, 0.18–0.68). For E, the sPD-1 cutoff was 135 pg/mL (high, n = 26; low, n = 24), and the median PFS was 5.2 versus 2.8 months for low and high sPD-1, respectively (log-rank P = 0.459), with an HR of 0.78 (95% CI, 0.41–1.50). For F, the sCTLA-4 cutoff was 1.85 pg/mL (high, n = 21; low, n = 29), and the median PFS was 5.7 versus 2.7 months for low and high sCTLA-4, respectively (log-rank P = 0.074), with an HR of 0.54 (95% CI, 0.27–1.06). (G) Kaplan-Meier curves for PFS among patients according to the number of favorable immune factors defined as sCTLA-4 or sPD-L1 levels below the cutoff values (log-rank P = 0.015). Median PFS was 14.1, 4.5, and 1.5 months for 2, 1, and 0 favorable factors, respectively. The HR for 1 (n = 14) versus 0 (n = 18) was 0.72 (95% CI, 0.34–1.53), and that for 2 (n = 18) versus 0 was 0.31 (95% CI, 0.14–0.72).

