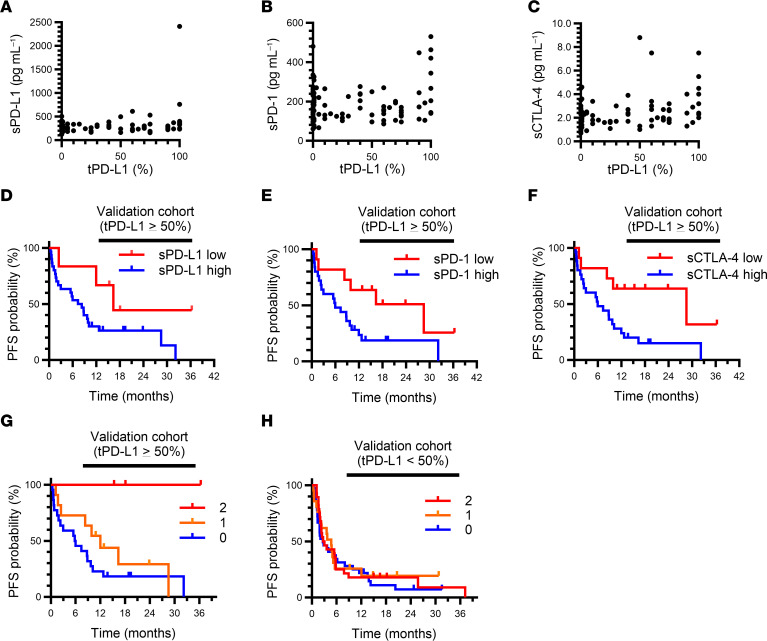
Figure 4. Soluble immune factors stratify advanced NSCLC patients with a tPD-L1 expression level of ≥ 50% according to responsiveness to PD-1/PD-L1 blockade therapy in the validation cohort (cohort B).
(A–C) Pearson correlation analysis of pretreatment plasma concentrations of sPD-L1 (A), sPD-1 (B), or sCTLA-4 (C) and tPD-L1 expression level (n = 121 patients). (D–F) Kaplan-Meier curves for PFS of patients with a tPD-L1 expression level of ≥ 50% according to high or low levels of soluble immune factors based on the determined cutoff values. For sPD-L1 (high, n = 30; low, n = 6), median PFS was 16.4 versus 7.4 months for low and high sPD-L1, respectively (log-rank P = 0.080), with an HR of 0.35 (95% CI, 0.11–1.19) (D). For sPD-1 (high, n = 25; low, n = 11), median PFS was 28.6 versus 6.0 months for low and high sPD-1, respectively (log-rank P = 0.035), with an HR of 0.38 (95% CI, 0.15–0.97) (E). For sCTLA-4 (high, n = 25; low, n = 11), median PFS was 28.6 versus 6.0 months for low and high sCTLA-4, respectively (log-rank P = 0.017), with an HR of 0.32 (95% CI, 0.12–0.86) (F). (G and H) Kaplan-Meier curves for PFS among patients with a tPD-L1 expression level of ≥ 50% (G) or < 50% (H) according to the number of favorable immune factors defined as concentrations of sCTLA-4 or sPD-L1 below the cutoff values (log-rank P = 0.028 and 0.57, respectively). Median PFS was not reached, 11.0 months, and 5.9 months for 2, 1, and 0 favorable factors, respectively, in G, and 2.9, 4.7, and 2.7 months, respectively, in H. The HR for 1 (n = 11 and 21) versus 0 (n = 22 and 36) was 0.61 (95% CI, 0.26–1.41) and 0.84 (95% CI, 0.46–1.54), and that for 2 (n = 3 and 28) versus 0 was 0.03 (95% CI, 0.00–3.43) and 0.88 (95% CI, 0.52–1.50), in (G) and (H), respectively.

