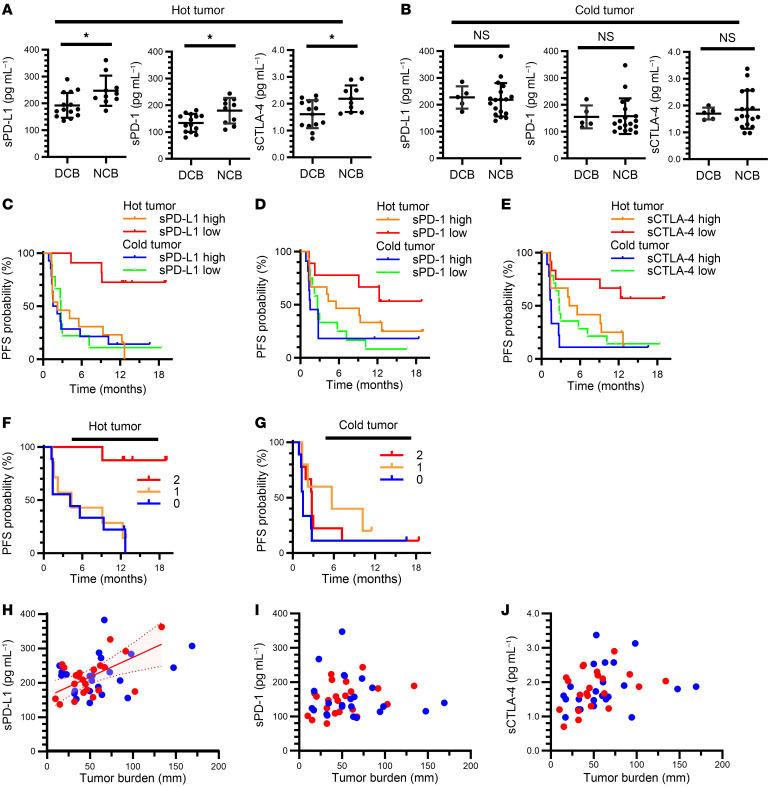
Figure 5. Soluble immune factors efficiently stratify patients with hot tumors in the Nivolution trial.
(A and B) Comparison of pretreatment plasma concentrations of sPD-L1, sPD-1, or sCTLA-4 between patients with a DCB or NCB among individuals with hot (A) or cold (B) tumors defined by the number of CD8+ T cells infiltrated into tumor tissue (≥ 12.0 and < 12.0/field, respectively). DCB, n = 14 and 5; NCB, n = 10 and 18 for hot and cold tumors, respectively. *P < 0.05; Mann-Whitney U test. (C–E) Kaplan-Meier curves for PFS according to hot or cold tumor status and high or low soluble factor levels based on the determined cutoff values. For sPD-L1, 2-sided log-rank P = 0.0023 for comparison among the 4 groups, where n = 11 (sPD-L1 low) and 13 (sPD-L1 high) among hot tumors as well as n = 9 (low) and 14 (high) among cold tumors; and median PFS was not reached, 2.2 months, 2.8 months, and 1.9 months, respectively (C). For sPD-1, 2-sided log-rank P = 0.055; n = 9 (sPD-1 low) and 15 (sPD-1 high) among hot tumors as well as n = 12 (low) and 11 (high) among cold tumors; and median PFS was not reached, 5.6 months, 2.7 months, and 1.5 months, respectively (D). For sCTLA-4, 2-sided log-rank P = 0.0093; n = 12 (sCTLA-4 low) and 12 (sCTLA-4 high) among hot tumors as well as n = 14 (low) and 9 (high) among cold tumors; and median PFS was not reached, 4.9 months, 2.8 months, and 1.5 months, respectively (E). (F and G) Kaplan-Meier curves for PFS of patients with hot (F) or cold (G) tumors according to the number of favorable immune factors defined as concentrations of sCTLA-4 or sPD-L1 below the cutoff values (2-sided log-rank P = 0.0034 and 0.30, respectively). Median PFS was not reached, 4.3 months, and 4.1 months for 2, 1, and 0 favorable factors, respectively, for hot tumors (F), and was 2.8, 5.7, and 1.5 months, respectively, for cold tumors (G). The HR for 1 (n = 7 and 5) versus 0 (n = 9 and 9) was 0.85 (95% CI, 0.29–2.44) and 0.46 (95% CI, 0.13–1.57), and that for 2 (n = 8 and 9) versus 0 was 0.07 (95% CI, 0.01–0.55) and 0.58 (95% CI, 0.21–1.56), for hot and cold tumors, respectively. (H–J) Pearson correlation analysis of tumor burden and plasma concentrations of sPD-L1 (H), sPD-1 (I), or sCTLA-4 (J) for hot (red) and cold (blue) tumors. Hot tumors in H show moderate linearity, with an R of 0.59 and P = 0.004. The red shaded area above and below the solid line and bounded by the dotted lines indicates the 95% CI.

