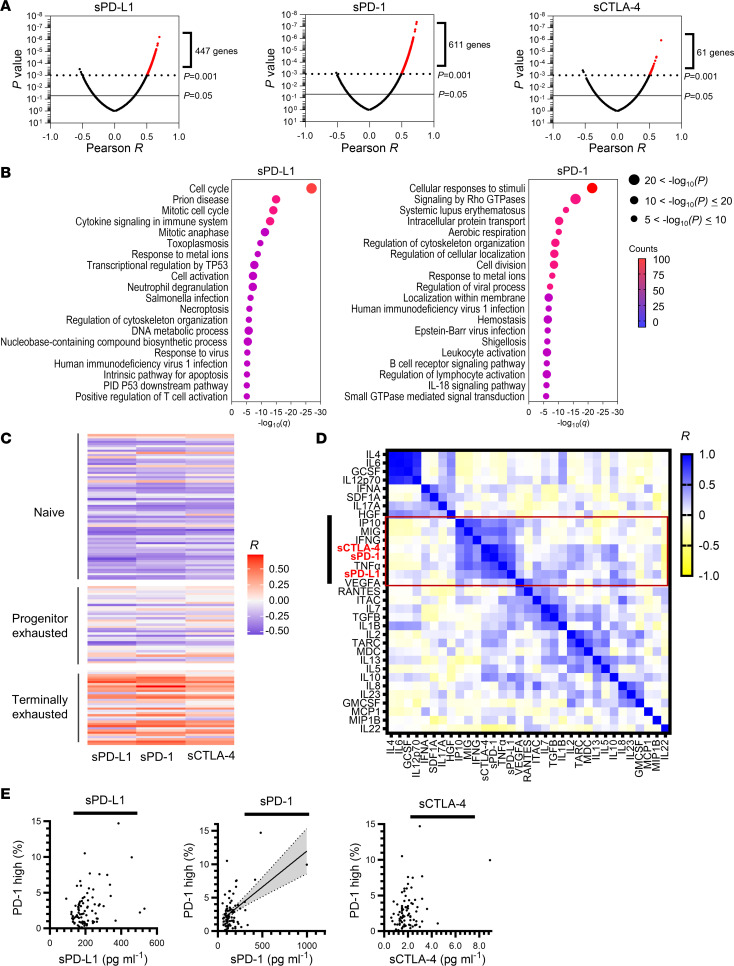
Figure 6. Analysis of gene expression in peripheral CD8+ T cells and circulating cytokine levels.
(A) Volcano plots of Pearson correlation (x-axis) and significance (y-axis) for the expression of individual genes in peripheral CD8+ T cells as determined by microarray analysis and pretreatment plasma concentrations of sPD-L1, sPD-1, or sCTLA-4 in cohort B (validation cohort, n = 40 patients). (B) Enrichment analysis for genes whose expression was positively correlated with sPD-L1 (447 genes) or sPD-1 (611 genes) levels as shown in A at P values of < 0.001. The plots show the FDR (q) value (x-axis), adjusted P value (dot size), and gene counts (color). The number of correlated genes for sCTLA-4 was not sufficient for enrichment analysis. (C) Heat map of Pearson correlation between soluble immune factor concentrations and the expression of gene sets characteristic of naive, progenitor exhausted, or terminally exhausted CD8+ T cells as determined by microarray analysis as in A. (D) Correlation between the plasma concentrations of 30 cytokines as well as those of sPD-L1, sPD-1, and sCTLA-4 in 50 patients of cohort A (Nivolution trial). Hierarchical clustering was performed according to the concentrations of the cytokines and soluble immune factors. (E) Scatter plots of soluble immune factor levels and the frequency of PD-1hi CD8+ T cells in peripheral blood (n = 84 from cohorts B and C). A moderate correlation between sPD-1 levels and the frequency of PD-1hi CD8+ T cells was apparent, with an R value of 0.51 and P < 0.0001; the gray shaded area above and below the solid line and bounded by the dotted lines indicates the 95% CI.

