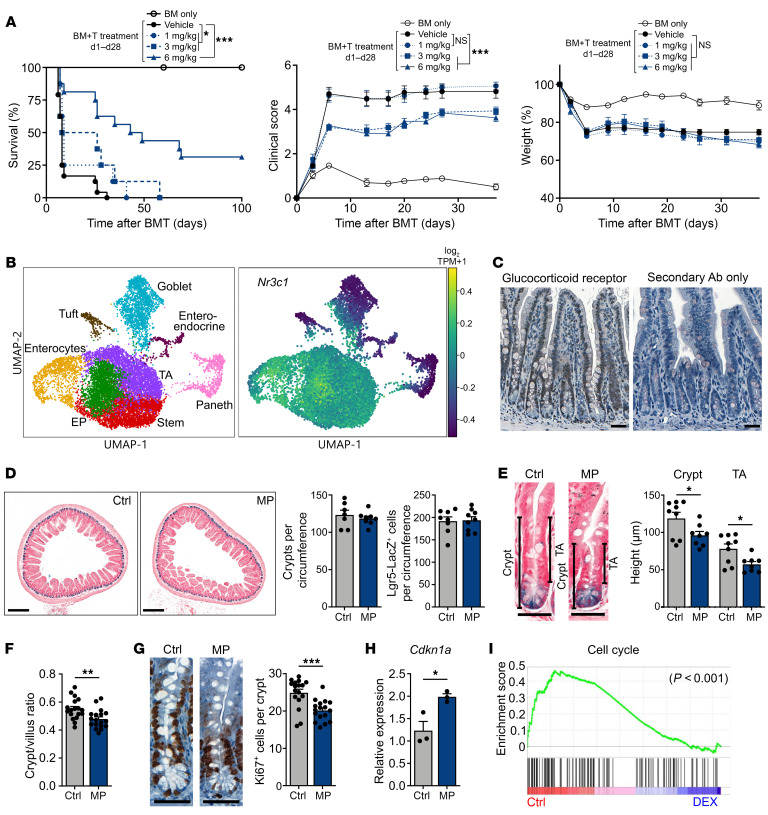
Figure 1. CS treatment reduces epithelial proliferation in vivo.
(A) Survival percentage, GHVD clinical score, and relative weights of B6-into-BALB/c BMT recipients, with or without prednisolone (1, 3, or 6 mg/kg i.p. daily from day 1 to day 28 after BMT); n = 13 (BM only), n = 24 (BM plus T cells, vehicle), n = 8 (BM plus T cells, 1 mg/kg), n = 8 (BM plus T cells, 3 mg/kg), and n = 16 (BM plus T cells, 6 mg/kg) mice per group. Data were combined from 2 independent experiments. (B) UMAP visualization of 12,457 SI epithelial cells from naive WT B6 mice. Left map shows unsupervised clustering based on the expression of known marker genes; right map shows expression of Nr3c1. TPM, transcripts per million. (C) IHC images of GR staining in ileal sections from naive WT mice. Scale bars: 50 μm. (D–H) WT B6 mice were treated with MP (2 mg/kg i.p. daily for 7 days) or vehicle control (Ctrl). Results are representative of 2 experiments. (D) Representative Lgr5-Lacz images and ileal crypt and ISC frequencies (n = 7–9 independent sections per group). Scale bars: 250 μm. (E and F) Representative Lgr5-Lacz SI crypt images and data on ileal crypt height, TA height, and crypt/villus height ratio (n = 8–18 independent sections per group). Scale bars: 50 μm. (G) Ki67 IHC images and Ki67+ cell frequencies (n = 17 independent sections per group). Scale bars: 50 μm. (H) RT-qPCR to determine Cdkn1a expression in ileal tissue (n = 3 mice per group). (I) GSEA of Kyoto Encyclopedia of Genes and Genomes (KEGG) cell-cycle pathway genes in SI epithelial cells from WT mice treated with DEX or vehicle. The nominal P value is shown. *P < 0.05, **P < 0.01, and ***P < 0.001, by log-rank test (A) or 2-tailed t test (D–H).

