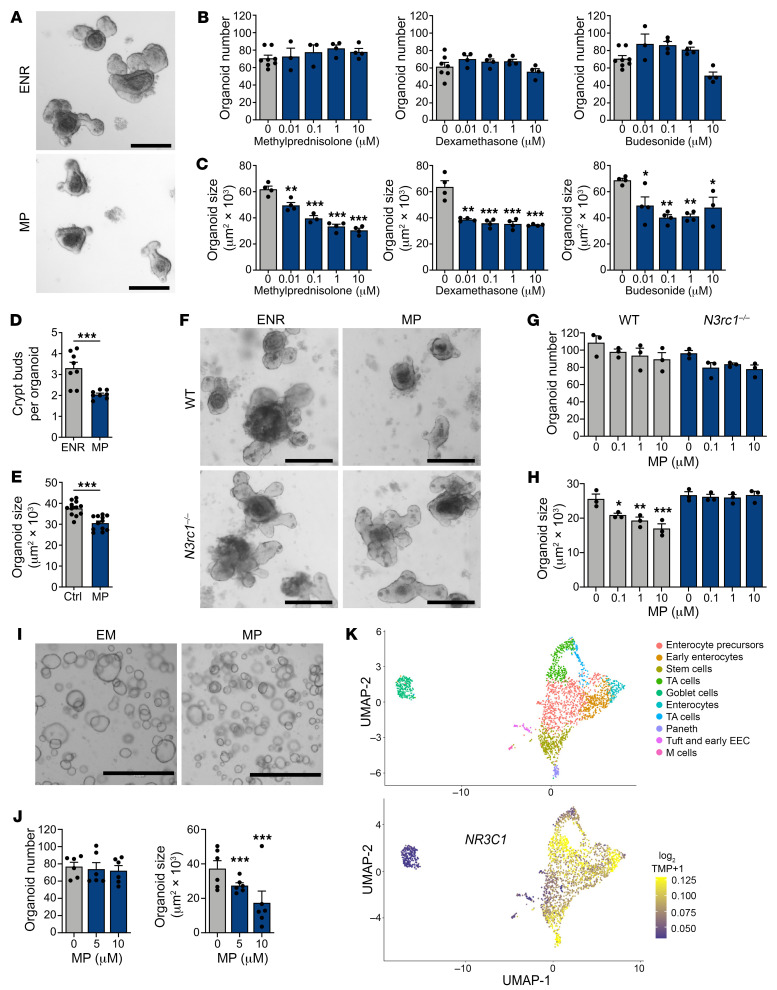
Figure 2. CS exposure limits the growth of murine and human SI organoids.
(A–C) Representative images and frequency and size of murine SI organoids cultured in ENR with or without MP, DEX, or budesonide for 7 days (n = 3–8 wells per group). Scale bars: 200 μm. (D) Frequency of crypt bud formation in SI organoids cultured with or without MP for 5 days (n = 8 wells per group). (E) Size of SI organoids derived from harvested crypts of WT mice treated i.p. with MP or vehicle in vivo. Organoids were cultured in ENR for 6 days (n = 12 wells per group). (F–H) Representative images and frequency and size of WT and Nr3c1–/– SI organoids cultured with or without MP for 4 days (n = 3 wells per group). Scale bars: 200 μm. (I and J) Representative images and frequency and size of human SI organoids cultured with or without MP (n = 6 wells per group). Scale bars: 1,000 μm. (K) UMAP visualization of 2,342 human epithelial cells from ileal crypts. Top map shows unsupervised clustering based on the expression of known marker genes. Bottom map shows the expression of NR3C1. EEC, enteroendocrine cells. *P < 0.05, **P < 0.01, and ***P < 0.001, by 2-tailed t test or 1-way ANOVA. Data are representative of at least 2 independent experiments or were combined from 2 independent experiments (I and J).

