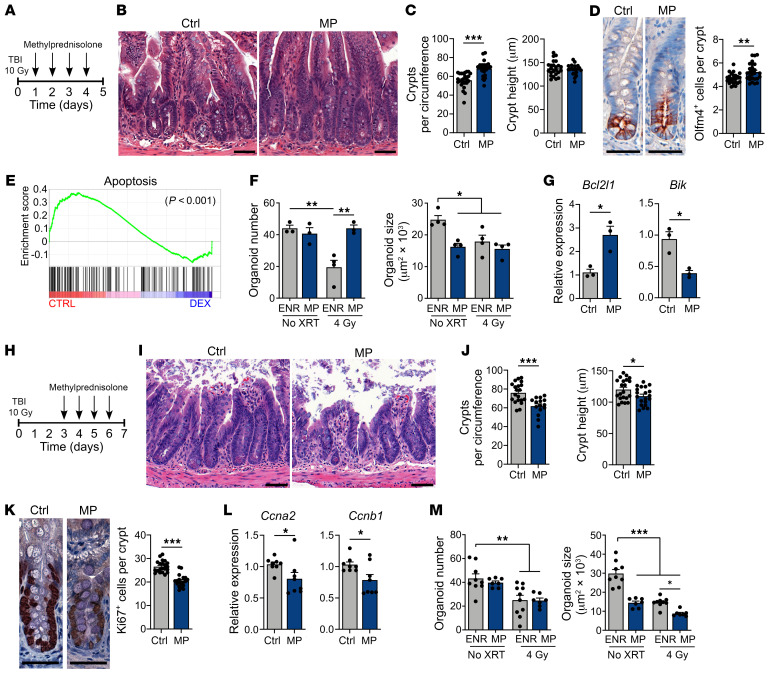
Figure 4. Epithelial effects of CS treatment after irradiation are timing dependent.
(A–D) WT B6 mice were treated with MP (2 mg/kg) or vehicle i.p. daily starting 24 hours after TBI. (B and C) Representative images, ileal crypt frequency, and height, 5 days after TBI (n = 21–25 sections per group). Scale bars: 50 μm. (D) Representative Olfm4 IHC staining and Olfm4+ cell frequencies 5 days after TBI (n = 25–27 sections per group). Scale bars: 50 μm. (E) GSEA of the MSigDB apoptosis gene set in SI epithelial cells from WT mice treated with DEX or vehicle. One analysis and a nominal P value are shown. (F and G) SI crypt cells were plated 4 hours prior to 4 Gy irradiation. Cultures were treated with MP (10 μM) 16 hours after irradiation. (F) Organoids were evaluated for frequency and size 3 days after irradiation (n = 3–4 wells per group). (G) Bcl2l1 and Bik expression was determined by RT-qPCR 48 hours after irradiation (n = 3 wells per group). (H–L) WT B6 animals were treated with MP (2 mg/kg) or vehicle i.p. daily, starting 72 hours after TBI. (I and J) Representative images and ileal crypt frequency and height (n = 15–21 sections per group), 7 days after TBI. Scale bars: 50 μm. (K) Representative Ki67 IHC images and data showing Ki67+ cell frequencies, 7 days after TBI (n = 19–21 sections per group). Scale bars: 50 μm. (L) RT-qPCR showing Ccna2 and Ccnb1 expression in enriched SI crypts, 7 days after TBI (n = 8 animals per group). (M) SI crypt cells were plated 4 hours prior to 4 Gy irradiation; cultures were treated with MP (10 μM) 3 days after irradiation. Seven days after irradiation, organoids were evaluated for frequency and size (n = 7–10 wells per group). *P < 0.05, **P < 0.01, and ***P < 0.001, by 2-tailed t test or 1-way ANOVA. Data are representative of at least 2 independent experiments or were combined from 2 independent experiments (A–D and H–L).

