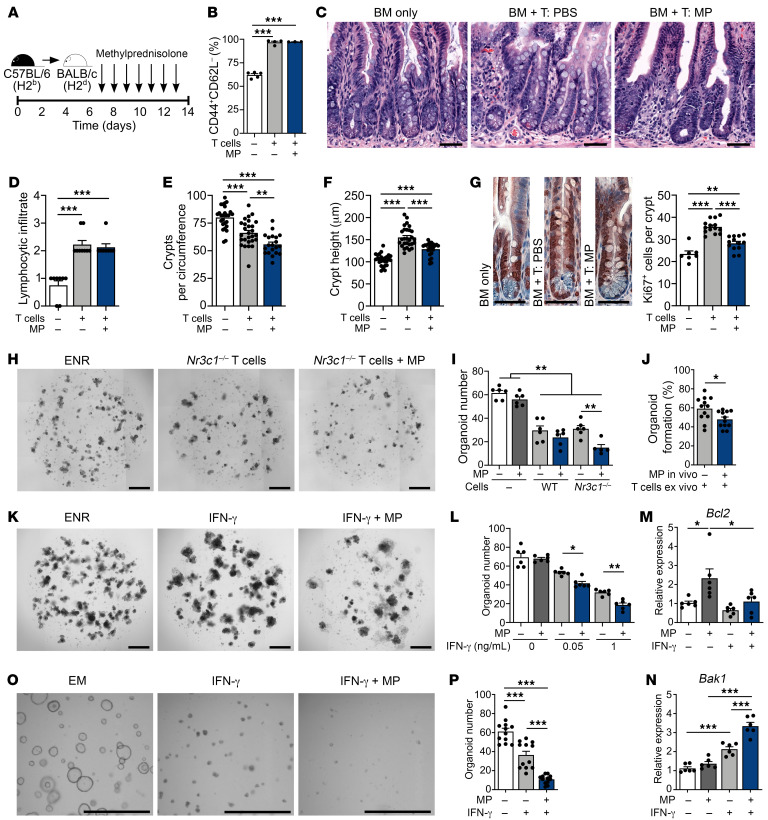
Figure 5. CS impair epithelial regeneration, increasing the severity of in vivo and ex vivo immune-mediated GI damage.
(A–G) B6-into-BALB/c transplantation of BM with or without T cells; recipient mice were treated with MP (2 mg/kg) or vehicle i.p. daily, starting on day 7 through day 14 after BMT. Recipient mice were evaluated on day 14 after BMT. (B) CD44+CD62L– cell proportion of CD45+CD3+CD4+CD8– splenocytes (n = 3–5 mice per group). (C) Representative images of ileum. Scale bars: 50 μm. (D) SI lymphocytic infiltrate histopathology score (n = 8–9 mice per group). (E and F) Ileal crypt frequency and height (n = 20–28 sections per group). Scale bars: 50 μm. (G) Representative images and Ki67+ cell frequency (n = 7–14 sections per group). (H and I) Representative images and B6 SI organoid frequency after culturing with or without anti-CD3/CD28–activated Nr3c1fl/fl or Nr3c1fl/fl Cd4-Cre B6 T cells with or without MP (10 μM) for 4 days (n = 5–6 wells per group). Scale bars: 500 μm. (J) B6 SI organoid frequency after in vivo MP (or vehicle) treatment prior to crypt isolation and subsequent culturing with anti-CD3/CD28–activated WT B6 T cells on day 6 of culturing (n = 12 wells per group). (K and L) Representative images and organoid frequency after culturing with or without MP (10 μM) and rmIFN-γ for 6 days (n = 6 wells per group). Scale bars: 500 μm. (M and N) qPCR to determine Bcl2 and Bak1 expression in organoids cultured with or without MP (10 μM) and rmIFN-γ (1 ng/mL) for 3 days (n = 6 wells per group). (O and P) Representative images and human organoid frequency after culturing with or without MP (10 μM) and rhIFN-γ (2 ng/mL) for 7 days (n = 12 fields of view in 6 wells per group). Scale bars: 1,000 μm. *P < 0.05, **P < 0.01, and ***P < 0.001, by 2-tailed t test or 1-way ANOVA. Data are representative of at least 2 independent experiments or were combined from 2 experiments (A–G).

