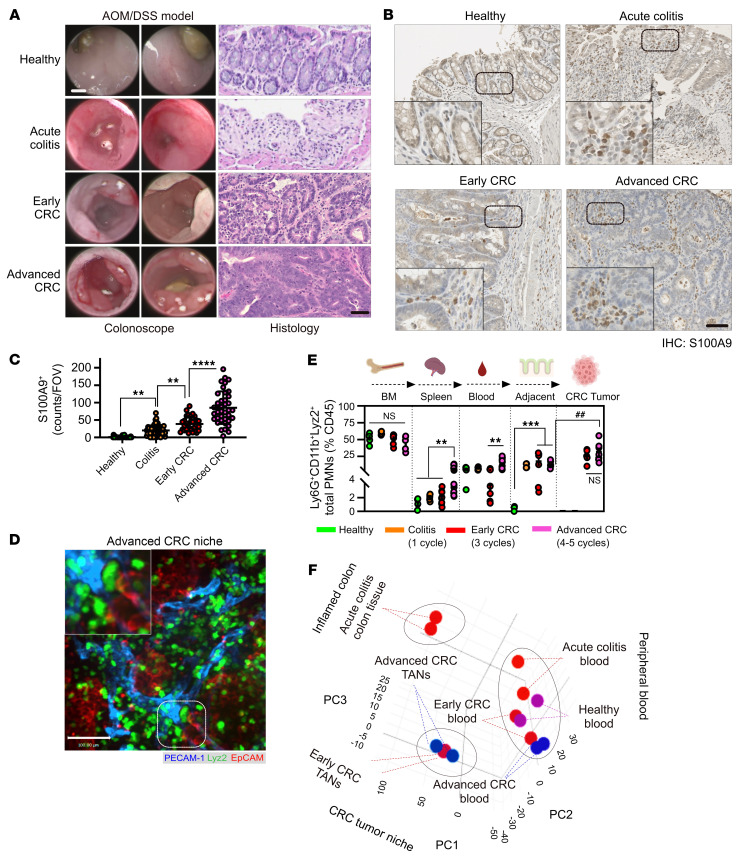
Figure 1. Tissue compartmentalization of PMN immunophenotypes during colitis-to-CRC transition.
(A) Endoscopic (left) and histological images (right) of healthy, ulcerated and CRC-bearing colons induced by AOM/DSS treatment. Acute colitis 1 DSS cycle, early and advanced CRC with 3 and 5 DSS cycles, respectively. Images representative of n = 4 independent experiments. Scale bars: 1 mm for endoscopy and 100 μm for H&E. (B) IHC staining and (C) quantification of S100A9 PMNs in healthy, inflamed colitis and AOM/DSS induced tumors (n = 3–4 mice per condition, with approximately 50 fields of view [FOVs]per condition). Insets are higher magnification images showing PMN accumulation in tumors. Scale bar: 50 μm. (D) Whole-mount confocal imaging of AOM/DSS-induced CRC tumors in Lyz2EGFP reporter mice. ECs were visualized by PECAM-1 and tumor cells by EpCAM staining. The inset shows magnified image of area highlighted by dotted line, depicting PMN interacting with blood vessels within the tumor niche. Scale bar: 50 μm. Images representative of n = 4 independent experiments. (E) Flow cytometric analyses of Ly6G+/CD11b+/Lyz2EGFP PMN numbers across tissue compartments during CRC development. n = 5–8 for healthy and colitis and n = 8–12 for CRC. Data are shown as mean ± SEM. **P < 0.01, ***P < 0.001, significance between diseased conditions; ##P < 0.01, significance between cancer and adjacent tissue(1-way ANOVA with Tukey’s multiple comparison test). (F) 3D PCA matrix of RNA-Seq profiles of 7 spatiotemporal conditions. 3 separate PMN clusters (dotted circles) were identified, representing peripheral blood, inflamed colon, and CRC niches.

