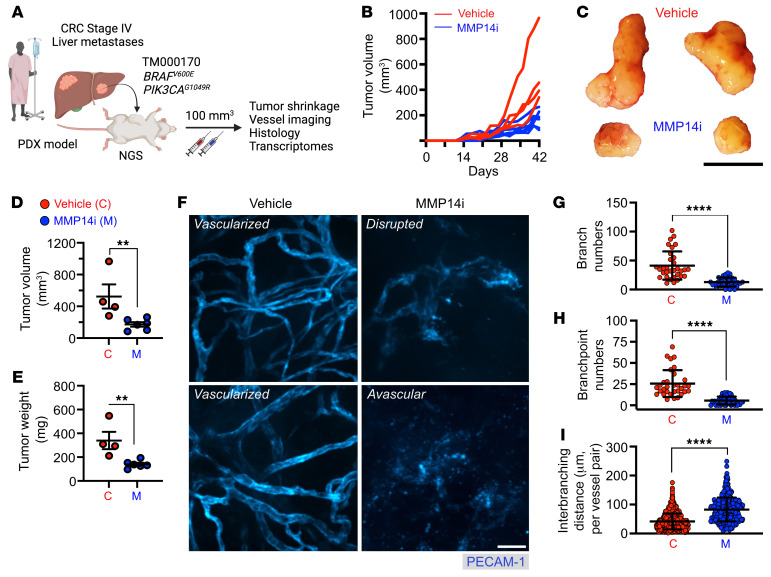
Figure 10. MMP14 inhibition curbs tumor growth in a CRC PDX model.
(A) Schematic of human CRC tumor grafting into NGS mice, followed by vehicle control (C) or MMP14i treatment (M, NSC405020, 2.0 mg/kg/day (45)). (B) Spaghetti plots of individual PDX tumor growth curves and (C) Representative endpoint PDX images (day 42/week 6). Scale bar: 1cm. (D) Quantification of endpoint tumor burden indexed by volume and (E) weight following MMP14 inhibition (vehicle, n = 4; MMP14i, n = 6 mice). (F) Representative whole-mount, fluorescence confocal microscopy images of endpoint PDX vasculature (stained for PECAM-1). Scale bar: 50μm. (G–I) Quantification of vascular architecture parameters from endpoint tumor vessel images. Images are representative of n = 4–6 mice per condition with 50–75 FOVs analyzed per group. For I, a total of approximately 1000 vessels per treatment were analyzed. **P < 0.01, ****P < 0.0001, 2-sided student’s t test.

