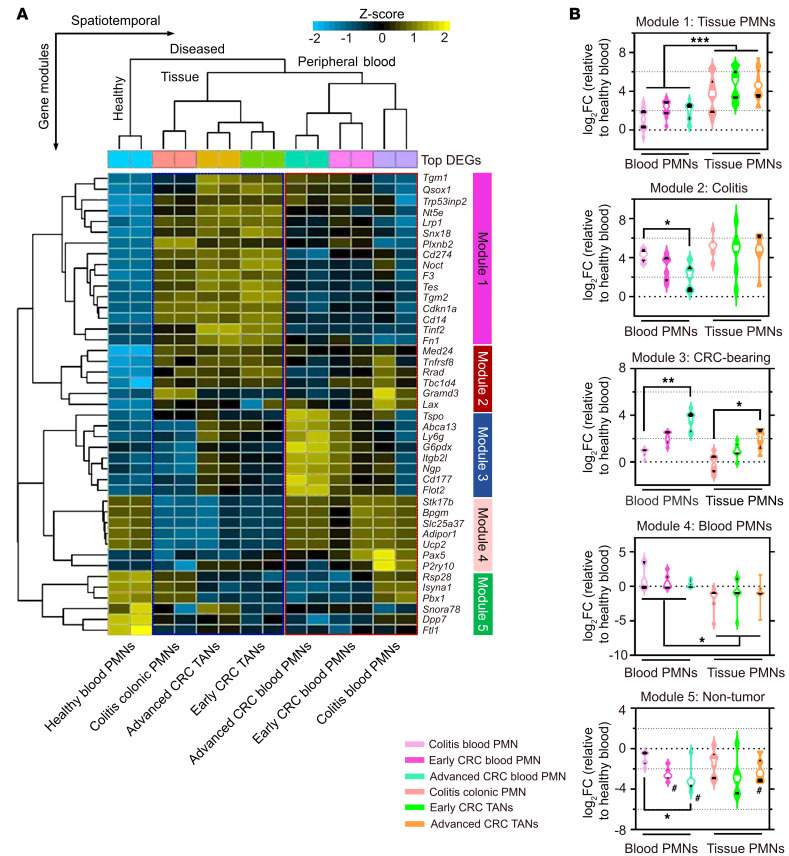
Figure 2. Distinct transcriptomic signatures define PMN/TAN tissue localization.
(A) Unsupervised hierarchical clustering of the top 50 DEGs with Benjamini-Hochberg’s correction (FDR < 0.05). Row-scaled heatmap representation. (B) Violin plots showing expression of DEGs in each module. Middle lines indicate median values (white) with 25th to 75th quartiles (black). *P < 0.05, **P < 0.01, ***P < 0.001, significance between diseased conditions; #P < 0.05, decreased compared with healthy blood, 2-sided Mann-Whitney U test.

