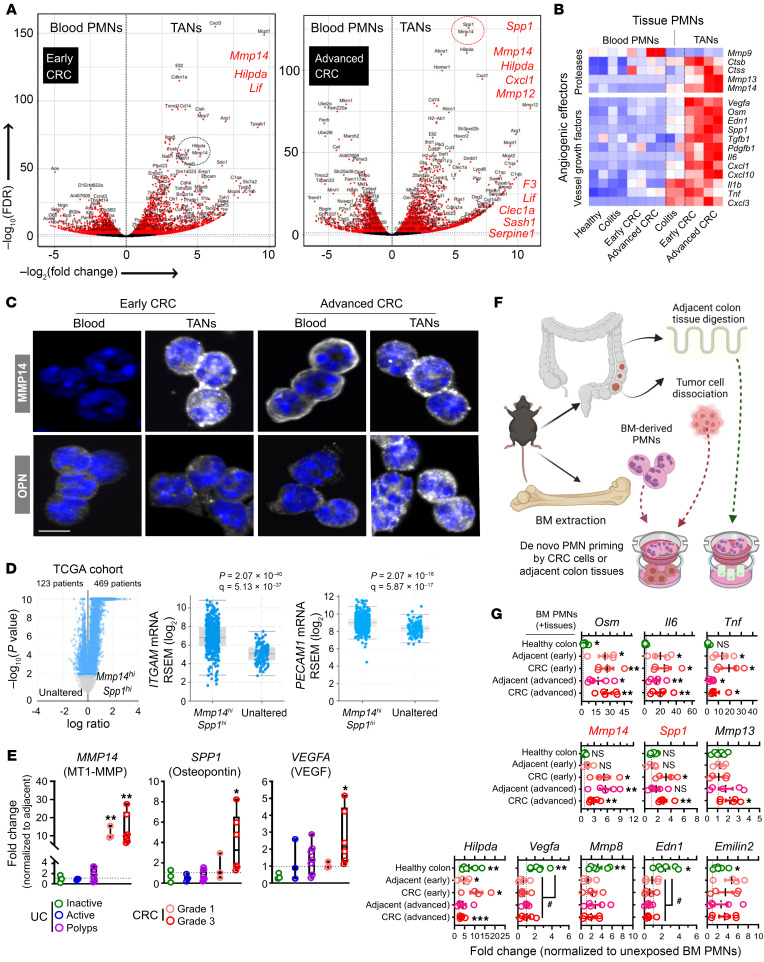
Figure 6. Angiogenic TANs express high levels of MMP14 and SPP1/OPN.
(A) Volcano plots of DEGs (red) enriched in peripheral blood PMNs and CRC TANs from early (left) and advanced (right) CRC. Red dotted circle highlights Spp1 (encoding OPN) and Mmp14 (encoding MT1-MMP) as top enriched genes in advanced CRC (P < 10–100). (B) Row-scaled heatmap representation of elevated levels of established angiogenic factors including proteases and vessel growth factors in TANs. (C) Representative confocal microscopy images of FACS-sorted blood PMNs and TANs from advanced CRC stained for intracellular levels of MMP14 and OPN proteins (white). Nuclei were by Hoechst staining (blue). Scale bar: 5 μm. Images representative of n = 4 independent experiments. (D) Volcano plot (left) stratified COAD patients from Pan-Cancer Atlas (n = 592) into altered (MMP14hi/SPP1hi, n = 469 with log ratio > 1.5, adjusted P cutoff = 0.01) or unaltered (n = 123 remaining patients) groups. Expression levels of PMN markers ITGAM/CD11b (middle) and EC marker PECAM1 (right) were compared between MMP14hi/SPP1hi and unaltered groups by 2-sided student’s t test (P value and FDR-adjusted q value are shown). (E) mRNA expression (normalized to adjacent noninflamed or noncancerous tissues) analysis of clinical specimens from UC patients (n = 3 inactive UC, n = 3 active UC, n = 10 severe UC polyps) and CRC patients (n = 3 grade 1, n = 6 grade 3). (F) Schematic and (G) mRNA expression analyses of established angiogenic genes in BM-derived PMNs following 24 hours incubation with dissociated healthy colon, CRC, or cancer-adjacent tissue. Gene expression was normalized to unexposed PMNs cultured in the same setup (n = 4 independent experiments). *P < 0.05, **P < 0.01, ***P < 0.001 (2-sided student’s t test, exposed versus unexposed BM-derived PMNs). #P < 0.05, 1-way ANOVA with Tukey’s multiple comparison test.

