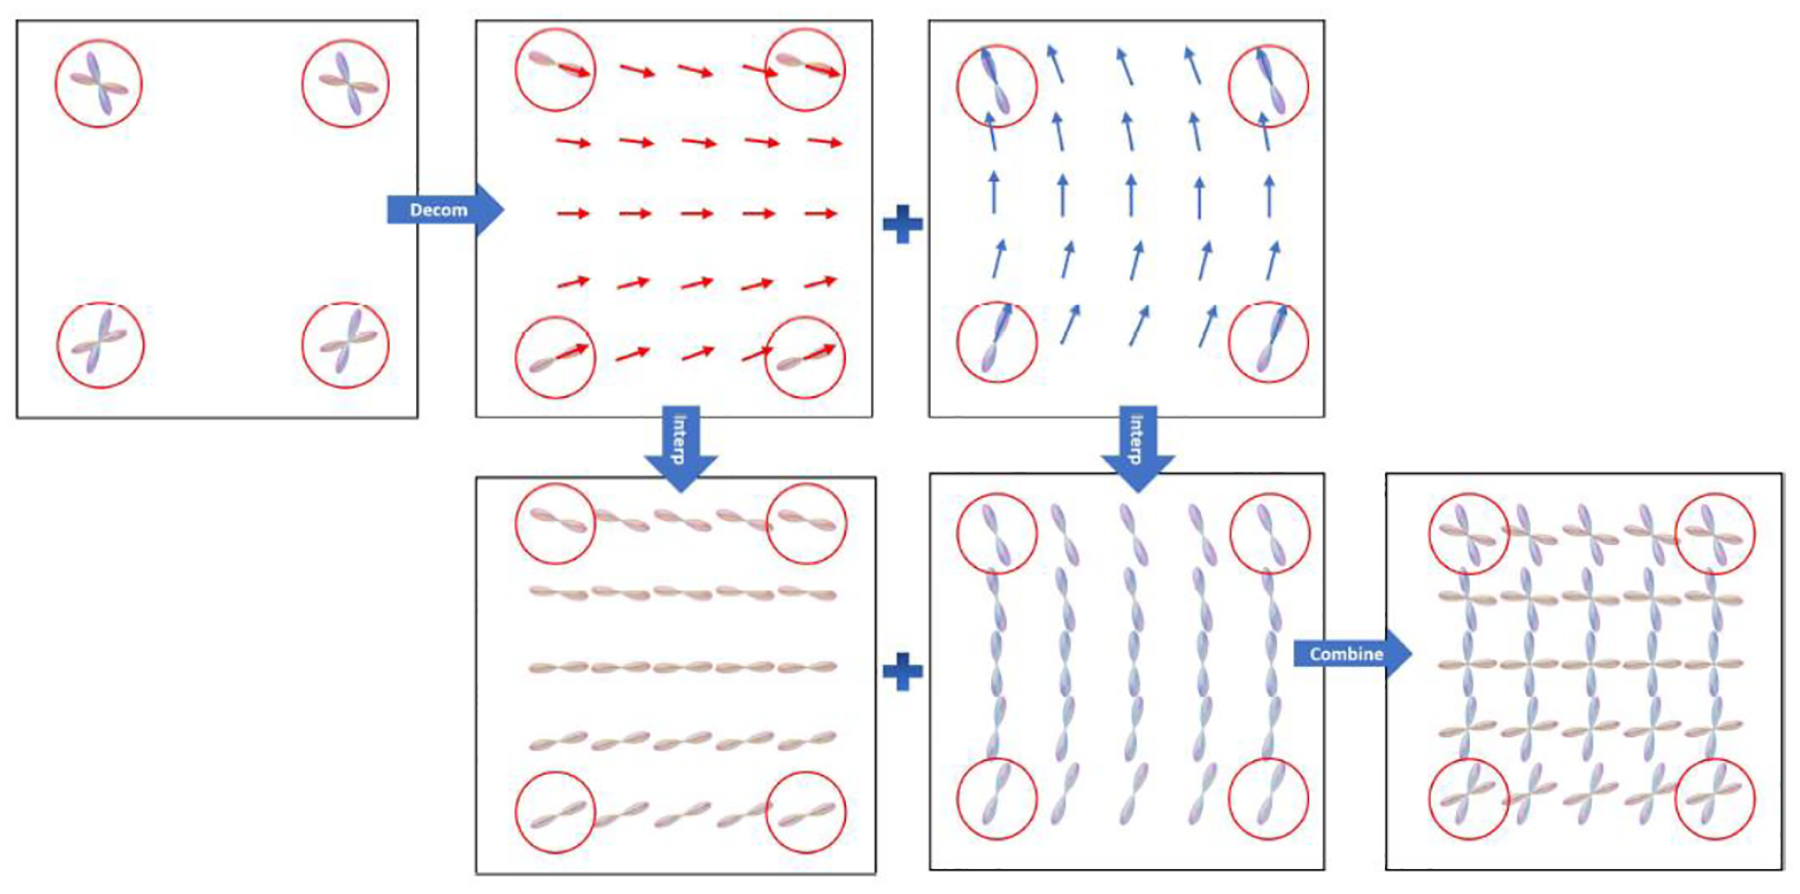
Figure 4.

In the flowchart, the original FODs are highlighted by red circles at the four corners. The FOD functions are decomposed into single-peak components in the first row and locally fitted by vector field flows. In the second row, we rotate the single-peak components at four corners to align with the vectors at each target point, and then we compute their weighted mean at each target point. Finally, we combine the single-peak components into complete FODs.
