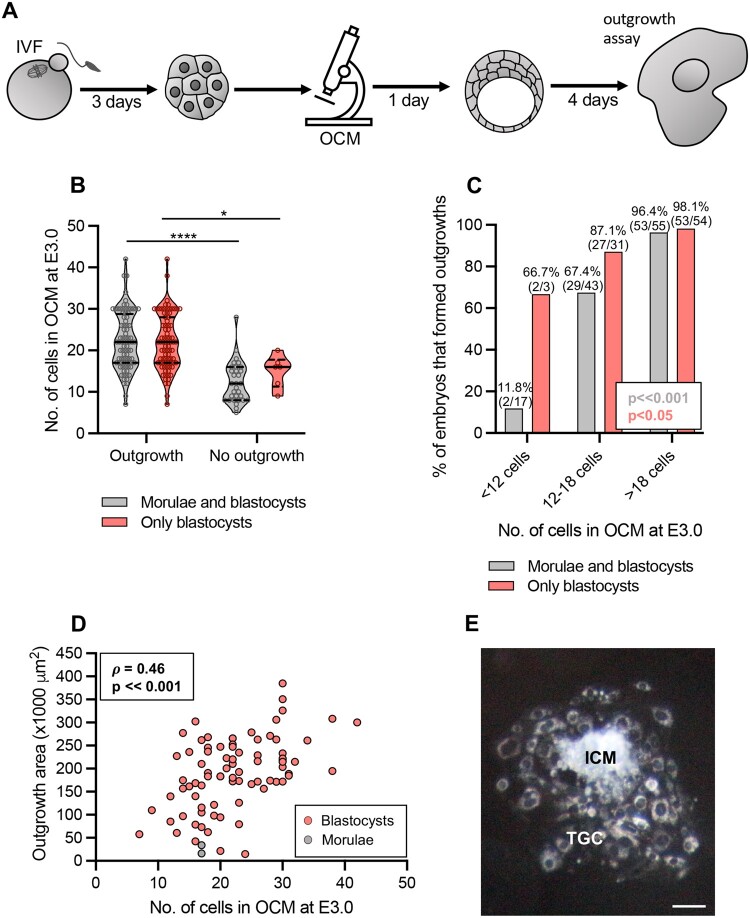
Figure 3.
Relation between the number of cells assessed by optical coherence microscopy in E3.0 mouse embryos and their ability to implant in vitro. (A) Scheme of the experimental design. (B) Relation between the number of cells assessed by optical coherence microscopy (OCM) in E3.0 (72 h after onset of insemination) embryos and their ability to form outgrowths. Violin plots show distribution of the analyzed data; the solid black line indicates median, the dashed black lines—first and third quartile values; *P < 0.05, ****P ≪ 0.001. (C) Percentage of embryos forming outgrowths in relation to their cell number assessed by OCM at E3.0. (D) Spearman’s rank correlation between the number of cells in embryos at E3.0 and the size of outgrowths formed by these embryos. (E) A representative image of a properly formed outgrowth. Scale bar 100 µm. (B–D) Embryos that were morulae or blastocysts on the day of plating for outgrowths (in gray) or only embryos that were blastocysts at that time (in red) were considered. One-hundred and fifteen embryos (84 that formed outgrowths and 31 that did not) were analyzed in (B and C) and 84 embryos in (D). ICM: inner cell mass; TGC: trophoblast giant cells.

