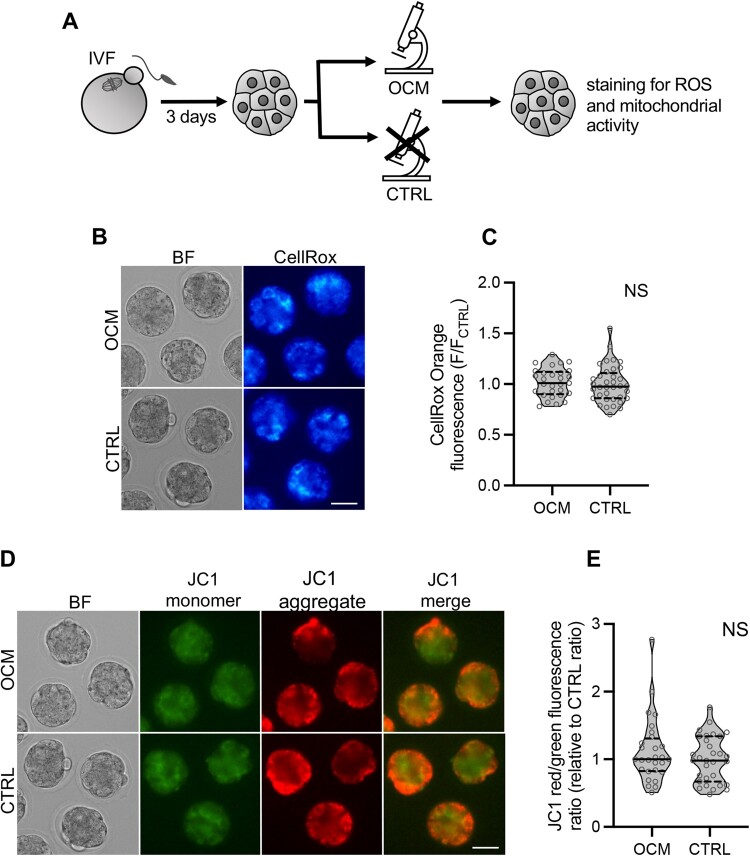
Figure 4.
Impact of optical coherence microscopy imaging on the amount of reactive oxygen species and mitochondrial activity in E3.0 mouse embryos. (A) Scheme of the experimental design. (B) Representative images of embryos scanned with optical coherence microscopy (OCM) and control embryos labeled for reactive oxygen species with CellRox Orange dye. Scale bar 50 μm. (C) Relative intensity of CellRox Orange fluorescence in OCM-imaged (n = 29) and control (n = 36) embryos. (D) Representative images (single planes) of OCM-scanned and control oocytes labeled with JC-1, an indicator of mitochondrial activity. In mitochondria with high membrane potential, JC-1 forms aggregates emitting red fluorescence. In mitochondria with low membrane potential, JC-1 remains in the monomeric form emitting green fluorescence. Scale bar 50 μm. (E) Relative ratios of JC-1 red to green fluorescence intensities in OCM-imaged (n = 28) and control (n = 31) embryos. A higher ratio indicates more active mitochondria. (C and E) Violin plots show distribution of the analyzed data; the solid black line indicates median, the dashed black lines—first and third quartile values; NS: P > 0.05. BF: bright field; CTRL: the control group, embryos unscanned; OCM: the experimental group, embryos scanned with optical coherence microscopy; ROS: reactive oxygen species.

