Figure 2.
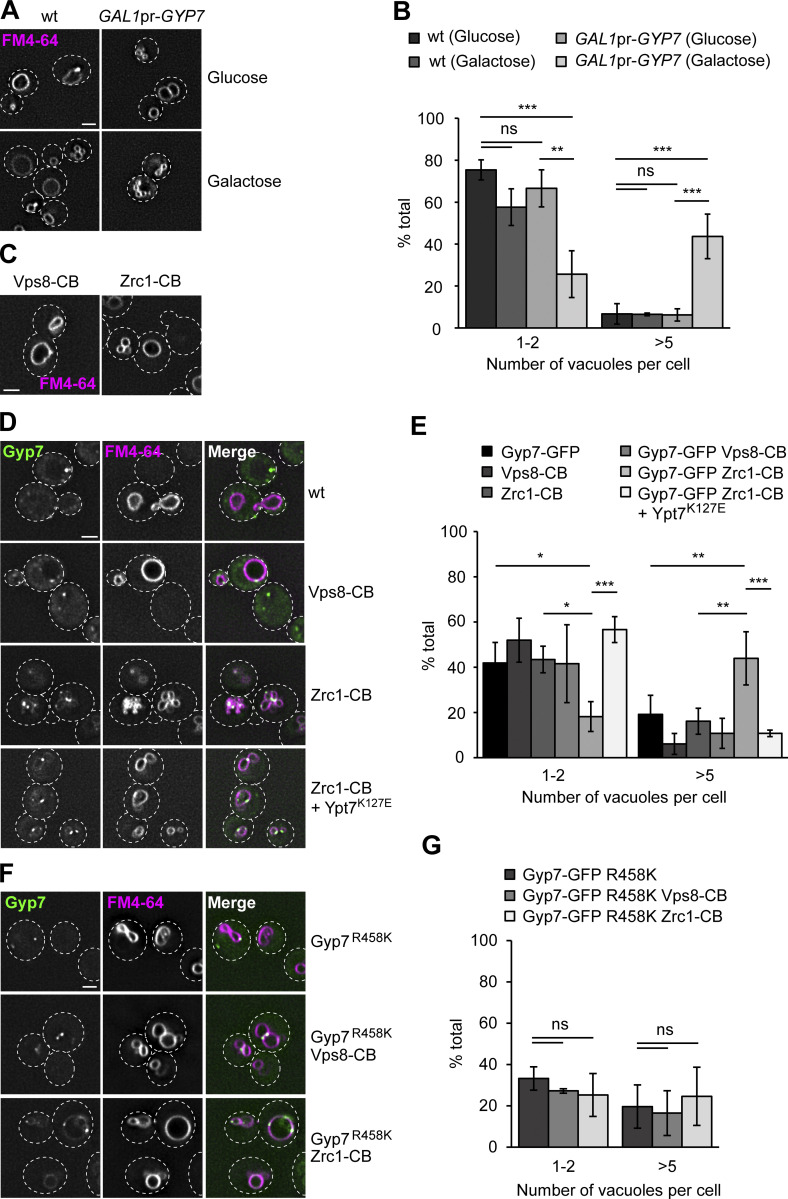
Vacuolar localization of Gyp7 impairs vacuolar function. (A) Vacuole morphology upon galactose-induced overexpression of Gyp7. Gyp7 was expressed from the GAL1 promoter. Wild-type (wt) cells and cells encoding GAL1pr-GYP7 were grown in glucose- or galactose-containing media (see Materials and methods). Vacuolar membranes were stained with FM4-64. Cells were imaged by fluorescence microscopy and individual slices are shown. Dashed lines indicate yeast cell boundaries. Scale bar, 2 μm. (B) Quantification of the number of vacuoles per cell in A. Cells were grouped into three different classes: 1–2 vacuoles, 3–4 vacuoles (not shown), and >5 vacuoles. Cells (n ≥ 100) from three independent experiments were quantified in Fiji. Bar graphs represent the averages and error bars the SD from three experiments. P value ns, **<0.01, ***<0.001 using ANOVA one-way test. (C) Vacuole morphology of cells expressing Vps8- or Zrc1-Chromobody. Vps8 and Zrc1 were C-terminally tagged with a nanobody against GFP (CB). Vacuolar membranes were stained with FM4-64. Cells were imaged by fluorescence microscopy and individual slices are shown. Dashed lines indicate yeast cell boundaries. Scale bar, 2 μm. (D) Vacuole morphology of cells with Gyp7 targeted to endosomes or the vacuole. Vps8 and Zrc1 were C-terminally tagged with CB in cells expressing Gyp7-GFP. Where indicated, a Ypt7 fast-cycling mutant (Ypt7K127E) was expressed from an integrative plasmid. Vacuolar membranes were stained with FM4-64. Cells were imaged by fluorescence microscopy and individual slices are shown. Dashed lines indicate yeast cell boundaries. Scale bar, 2 μm. (E) Quantification of the number of vacuoles per cell in C and D. Cells were classified as in B. Cells (n ≥ 150) from three independent experiments were quantified in Fiji. Bar graphs represent the averages and error bars the SD from three experiments. P value *<0.05, **<0.01 and ***<0.001, using ANOVA one-way test. (F) Vacuole morphology of cells expressing Gyp7R458K, the catalytic dead mutant of Gyp7. The mutation was introduced into cells expressing Gyp7-GFP. Where indicated, Vps8 and Zrc1 were C-terminally tagged with a CB. Vacuolar membranes were stained with FM4-64. Cells were imaged by fluorescence microscopy and individual slices are shown. Dashed lines indicate yeast cell boundaries. Scale bar, 2 μm. (G) Quantification of the number of vacuoles per cell in F. Cells were classified as in B. Cells (n ≥ 130) from three independent experiments were quantified in Fiji. Bar graphs represent the averages and error bars the SD from three experiments. P value ns, using ANOVA one-way test.

