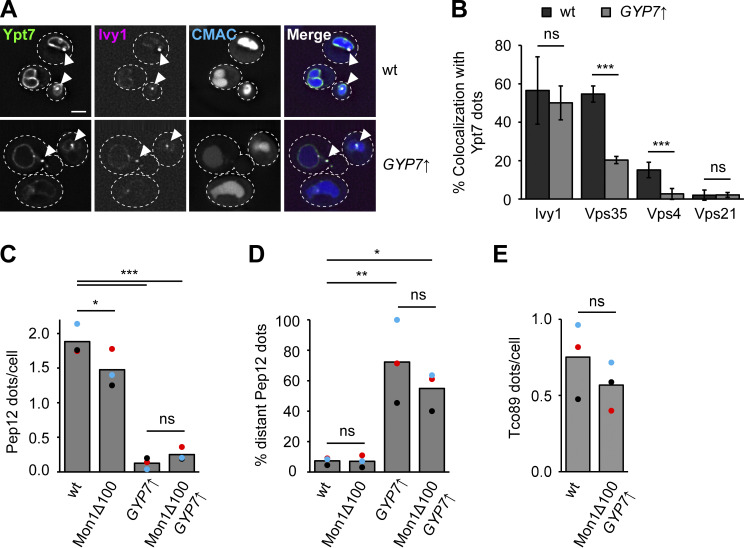
Figure 7.
Ypt7-positive puncta correspond to signaling endosomes. (A) Localization of mNeon-Ypt7 puncta relative to the endosomal marker Ivy1. Ivy1-mKate was expressed in TEF1pr-GYP7 or wild-type (wt) cells encoding endogenous mNeon-Ypt7. Vacuoles were stained with CMAC. Cells were imaged by fluorescence microscopy. Individual slices are shown. Arrowheads depict representative colocalization. Dashed lines indicate yeast cell boundaries. Scale bar, 2 μm. (B) Quantification of Ypt7 colocalizing with endosomal markers in A and Fig. S4 C. Cells (n ≥ 100) from three independent experiments were quantified in Fiji. Bar graphs represent the averages and error bars the SD from the three experiments. P value ns, ***<0.001, using two-sided Student’s t test. (C) Quantification of the number of Pep12 puncta per cell in Fig. S4 D. Cells (n ≥ 150) from three independent experiments were quantified in Fiji. Bar graphs represent the averages from three experiments and puncta represent the mean of each experiment. P value *<0.05, ***<0.001, using ANOVA one-way test. (D) Quantification of the percentage of distant Pep12 puncta in Fig. S4 D. The number of distant Pep12 puncta (not at the vacuole) was divided by the total number of Pep12 puncta per cell. Cells (n ≥ 150) from three independent experiments were quantified in Fiji. Bar graphs represent the averages from three experiments and puncta represent the mean of each experiment. P value *<0.05, **<0.01, using ANOVA one-way test. (E) Quantification of the number of Tco89 puncta per cell in Fig. S4 E. Cells (n ≥ 150) from three independent experiments were quantified in Fiji. Bar graphs represent the averages from three experiments and puncta represent the mean of each experiment. P value ns, using two-sided Student’s t test.

