Figure 8.
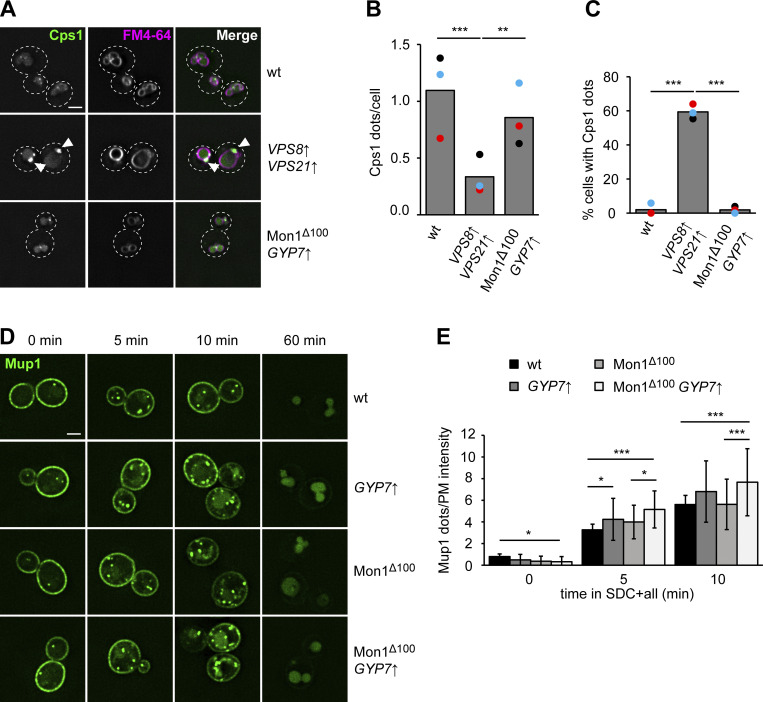
Enhanced Ypt7 cycling affects endocytic trafficking. (A) Localization of Cps1 in wild-type (wt), TEF1pr-VPS8 ADHpr-VPS21, and Mon1Δ100-Ccz1 TEF1pr-GYP7 cells. Vacuolar membranes were stained with FM4-64. Cells were imaged by fluorescence microscopy. Individual slices are shown. Arrowheads depict Cps1 accumulations next to the vacuole. Dashed lines indicate yeast cell boundaries. Scale bar, 2 μm. (B) Quantification of the number of Cps1 puncta per cell in A. Cells (n ≥ 140) from three independent experiments were quantified in Fiji. Bar graphs represent the averages from three experiments and puncta represent the mean of each experiment. P value **<0.01, ***<0.001, using ANOVA one-way test. (C) Quantification of the percentage of cells with Cps1 accumulations in A. The number of cells with Cps1 accumulations at the vacuole was divided by the total number of cells. Cells (n ≥ 140) from three independent experiments were quantified in Fiji. Bar graphs represent the averages from three experiments and puncta represent the mean of each experiment. P value ***<0.001, using ANOVA one-way test. (D) Endocytosis of Mup1 in cells with altered expression or activity of Gyp7 and Mon1–Ccz1. Cells were grown to logarithmic phase in SDC-MET media, analyzed by fluorescence microscopy, and then shifted to SDC+all media. Cells were imaged at indicated time points by fluorescence microscopy. Individual slices are shown. Scale bar, 2 μm. This is the same assay shown in Fig. 3 C with different mutants and time points analyzed. (E) Quantification of the number of puncta to plasma membrane fluorescence intensity of Mup1 ratio in D. For each cell, the number of Mup1 puncta was divided by the maximum fluorescence intensity of Mup1-GFP signal at the plasma membrane (PM). For each time point, cells (n ≥ 100) from three independent experiments were quantified in Fiji. Bar graphs represent the averages and error bars the SD from three experiments. P value *<0.05, ***<0.001, using ANOVA one-way test.

