Figure S1.
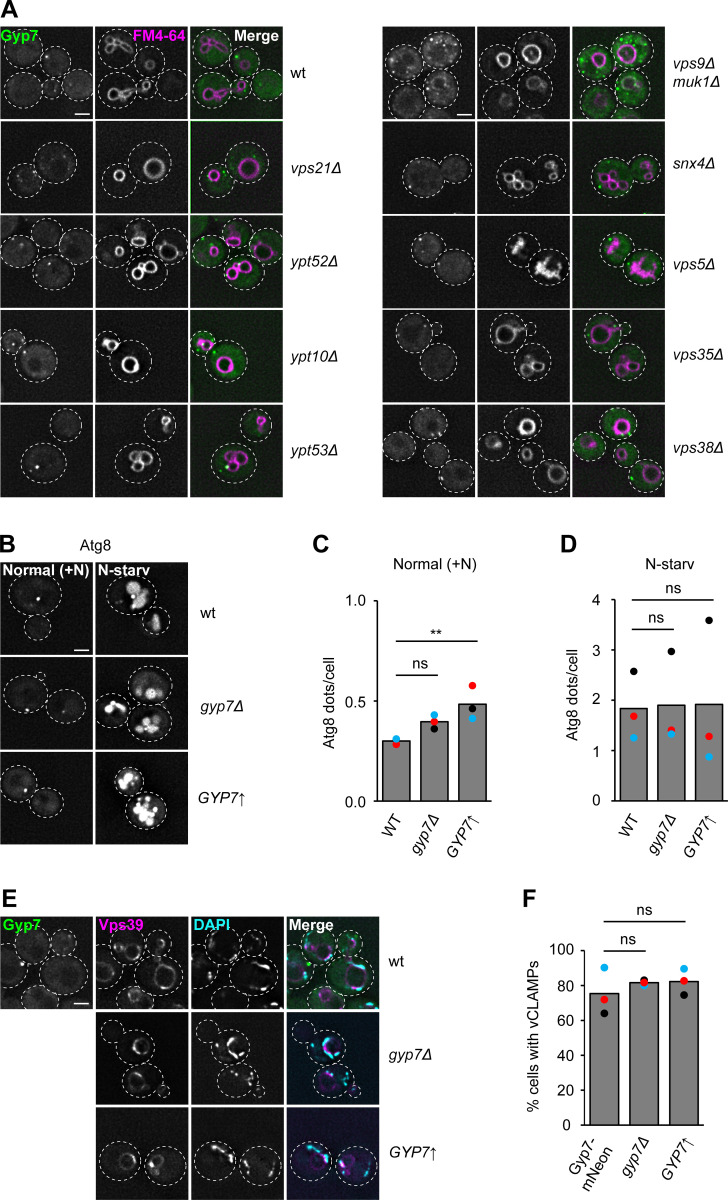
Gyp7 does not affect Ypt7 function in autophagy or vCLAMP formation. (A) Localization of Gyp7 in selected deletion mutants. Gyp7 was tagged with mNeonGreen in wild-type (wt), vps21Δ, ypt52Δ, ypt10Δ, ypt53Δ, vps9Δ muk1Δ, snx4Δ, vps5Δ, vps35Δ, and vps38Δ cells. Vacuolar membranes were stained with FM4-64. Cells were imaged by fluorescence microscopy and individual slices are shown. Dashed lines indicate yeast cell boundaries. Scale bar, 2 μm. (B) Localization of Atg8 upon deletion or overexpression of Gyp7. Gyp7 was either deleted or expressed from the TEF1 promoter in cells encoding the autophagy-specific marker protein mCherry-Atg8. Cells were grown in SDC+all and then shifted to SD-N for 1 h (see Materials and methods). Cells were imaged by fluorescence microscopy and individual slices are shown. Dashed lines indicate yeast cell boundaries. Scale bar, 2 μm. (C) Quantification of Atg8 dots per cell in B during growth. Cells (n ≥ 150) from three independent experiments were quantified in Fiji. Bar graphs represent the averages from three experiments and dots represent the mean of each experiment. P value ns, **<0.01, using ANOVA one-way test. (D) Quantification of Atg8 dots per cell in B during N-starvation. Quantification was performed as in C. P value ns, using ANOVA one-way test. (E) Formation of vCLAMPs upon deletion or overexpression of Gyp7. The vCLAMP-forming protein mCherry-Vps39 was expressed from the TEF1 promoter in cells encoding Gyp7-mNeonGreen, gyp7Δ, and TEF1pr-GYP7 cells. Mitochondria were stained with DAPI (see Materials and methods). Cells were imaged by fluorescence microscopy and individual slices are shown. Dashed lines indicate yeast cell boundaries. Scale bar, 2 μm. (F) Quantification of E. Colocalization of mCherry-Vps39 enrichments and DAPI-stained mitochondria was defined as vCLAMP. Cells with ≥1 vCLAMP were counted as vCLAMP-positive cells. Cells (n ≥ 150) from three independent experiments were quantified in Fiji. Bar graphs represent the averages from three experiments and dots represent the mean of each experiment. P value ns, using ANOVA one-way test.

