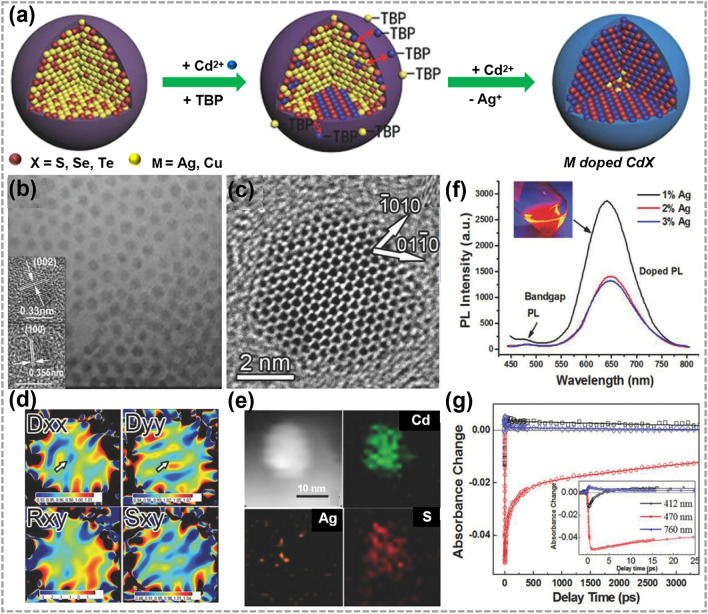
Fig. 5.
Synthesis and characterizations of 0D doped TMC materials by CE reactions. a Illustrations showing the synthesis process of M-doped CdX (M = Ag, Cu; X = S, Se, Te) nanocrystals. TBP represents tributylphosphine. b TEM image, c HRTEM images, d strain mapping images and e EDS elemental mapping images of Ag-doped CdS quantum dots (QDs). f Room temperature steady-state fluorescence spectra with different Ag-dopant concentrations, and the inset shows a digital photograph of fluorescence under 365 nm ultraviolet irradiation. PL represents photoluminescence. g Kinetic traces at representative wavelengths are also shown (pump laser wavelength: 390 nm). Reproduced with permission [100].
Copyright 2015, John Wiley and Sons

