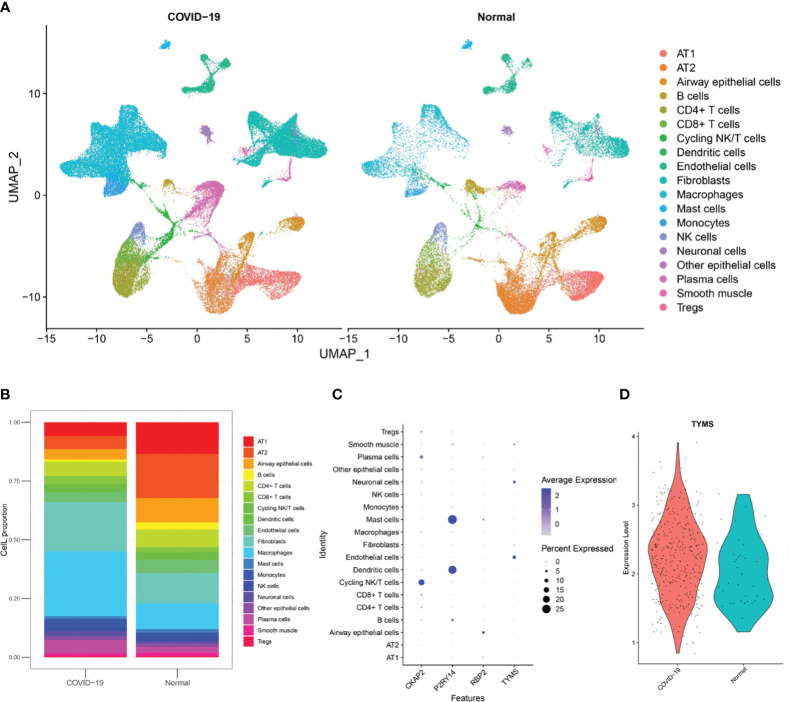
Figure 12.
Analysis of single-nuclei RNA-Seq data. (A) A uniform manifold approximation and projection map showing the 19 cell types found using unsupervised analysis. The data is sourced from post-mortem lung tissue samples of COVID-19 fatal cases and seven healthy donors. (B) The 19 cell type proportions. (C) Dot plot illustrating the hub ARDS-ARDEGs expression levels in several cell types. (D) A violin plot showing how COVID-19 patients and healthy donors differ in the expression of TYMS in endothelial cells.

