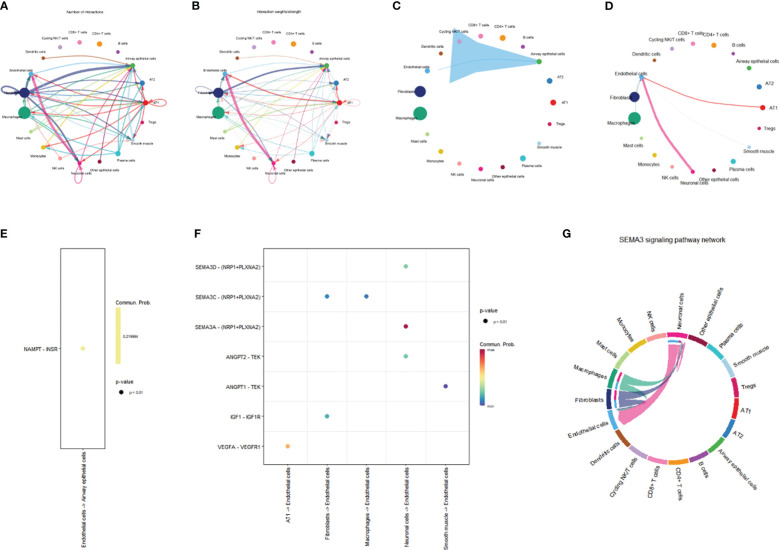
Figure 13.
Network representation of cell-cell communication. (A) Frequency-based network diagram demonstrating the varying degrees of interactions among different cell types. (B) Intensity-based network diagram showcasing the strength of interactions among diverse cell populations. (C) Communication pathways and their associated intensities originating from endothelial cells are illustrated in a network diagram. (D) Communication pathways and their respective strengths through which endothelial cells receive signals are visualized in a network diagram. (E) Scatter plot detailing the ligand-receptor signaling patterns emitted by endothelial cells. (F) Scatter plot depicting the ligand-receptor signaling received by endothelial cells. (G) Chord diagram illustrating the intricate SEMA3 signaling pathway.

