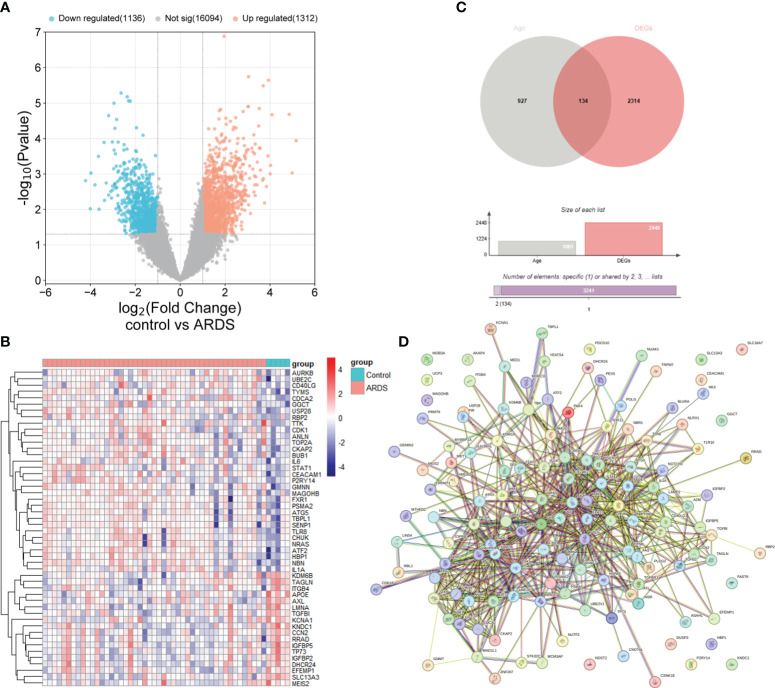
Figure 2.
Identification of ARDEGs between control and ARDS. (A) The differential gene expression between the control and ARDS groups is displayed using a volcano plot. (B) A Venn diagram illustrates the overlap between ARGs and DEGs in the ARDS and control groups. (C) A heatmap is presented illustrating the expression patterns of the 50 most significant ARDEGs, based on the smallest p-values, in both the control and ARDS groups. (D) An interaction network map shows protein interactions among the 134 ARDEGs.

