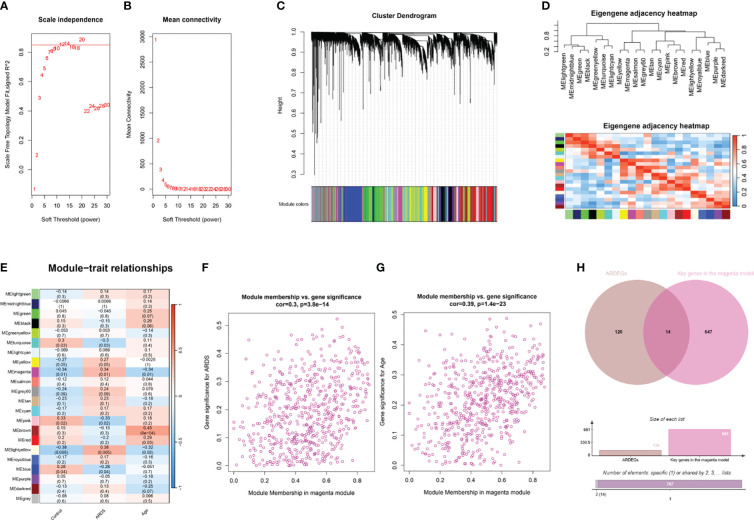
Figure 4.
WGCNA analysis and identification of ARDS-ARDEGs in GSE163426. (A) The soft thresholding power of WGCNA is shown. (B) The average connectivity of WGCNA is displayed. (C) The top 75% of the gene clustering tree’s variance is displayed, with each gene represented by a branch and a co-expression module by a color underneath. (D) The association of feature genes between modules is displayed on a heatmap. (E) A heatmap illustrating the correlations between the modules and traits is displayed; each color corresponds to a co-expression module, and the numbers indicate the p-values and module-trait correlation coefficients. (F) The relationship between the ARDS GS and the magenta module’s MM is displayed as a scatter plot. (G) A scatter plot illustrates the relationship between the magenta module’s MM and aging GS. (H) The intersection of ARDEGs along with significant genes in the magenta module is shown in a Venn diagram.

