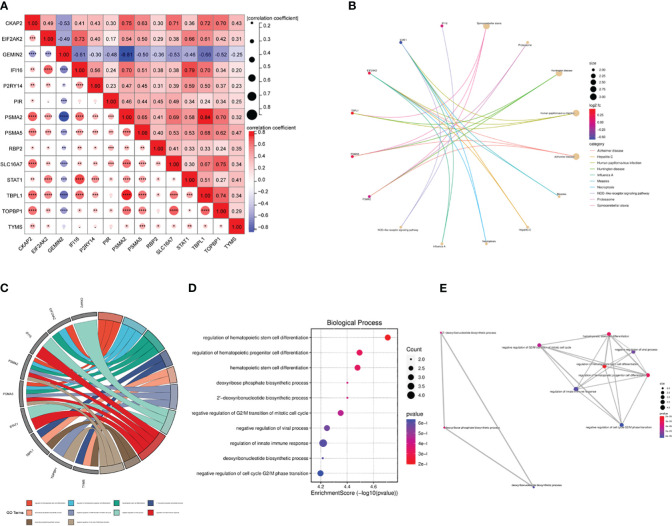
Figure 5.
The correlation and enrichment analysis of ARDS-ARDEGs. (A) The ARDS-ARDEG correlation analysis is shown, with statistical significance denoted by *P<0.05, **P<0.01, and ***P<0.001. (B) A circular plot illustrates the top 10 entries for KEGG enrichment analysis of ARDS-ARDEGs. (C) A chord plot shows the top 10 BP entries for GO enrichment. (D) A bubble plot is presented, displaying the BP entries for GO enrichment. (E) A network plot indicates the BP entries associated with the ARDS-ARDEG analysis.

