Figure 4.
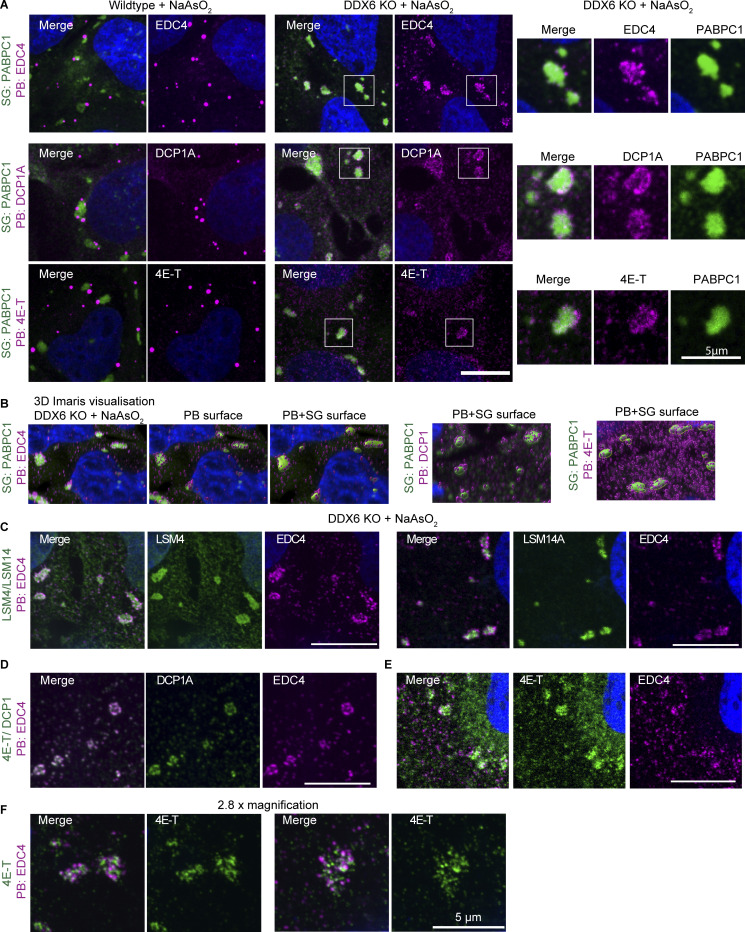
In the absence of DDX6, smaller PB-like assemblies colocalize or dock to SG. (A) IF images comparing EDC4, DCP1A, and 4E-T (magenta) PB localization in wild type and redistribution or docking to SGs (green) in DDX6 KO cells. Corresponding zoom images of selected SGs (indicated by white box) are shown on the right. (B) SoRa images of stressed DDX6 KO cells visualized in 3D using Imaris. Left: PABPC1 (green) and EDC4 (magenta) z-stacks (left), with added PB surfaces (center) and PB–SG surfaces (right). PABPC1-DCP1A or PABPC1-4E-T PB–SG surface 3D images are shown in middle and right. (C) SoRa IF images highlighting SG localization of PB proteins LSM4 and LSM14 in DDX6 KO cells. (D) SoRa IF images depicting EDC4 and DCP1A colocalization. (E) SoRa IF images depicting different localization patterns between 4E-T and EDC4. (F) SoRa IF images but with 2.8× magnification of 4E-T and EDC4 assemblies. All IF images are representative images of three independent biological replicates with more than three images analyzed per replicate. Scale bar, 10 μm if not indicated.

