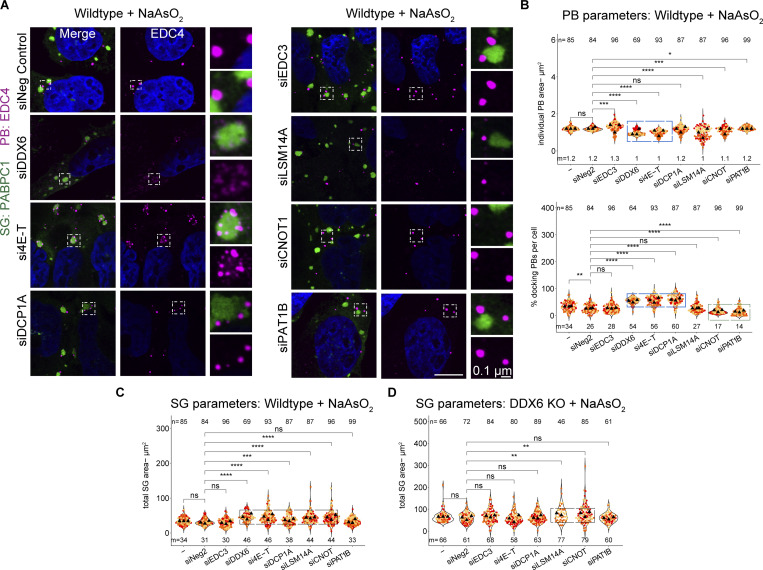
Figure 5.
siRNA knockdowns of various PB components lead to an increase in SGs, docking of smaller PBs, or loss of PB–SG docking. (A) IF images of PBs (EDC4 IF, magenta) and SGs (PABPC1, green) in wild-type cells upon siRNA knockdown of various PB proteins. (B) Quantification of total PB area per cell and % docking interactions with SGs in wild-type cells. Blue boxes highlight conditions that affect the size of PBs (top) that increasingly dock to SGs (bottom). The green box highlights conditions that lead to reduced PB–SG docking. (C) Quantification of total SG area per cell in wild-type cells. Black boxes highlight conditions that lead to an increase in SGs. (D) Quantification of total SG area per cell in DDX6 KO cells. Black boxes highlight conditions that lead to an increase in SGs. All IF images are representative images of three independent biological replicates with more than three images analyzed per replicate. For quantification in B–E, data points from three biological replicates are shown in red-orange-pink, the mean replicate values are indicated as triangles, and mean values are shown at the bottom of the image (m). The number (n) of analyzed cells is shown at the top of the image. ****P ≤ 0.0001, ***P ≤ 0.001, **P ≤ 0.01, *P ≤ 0.05, n.s. P > 0.05 (unpaired, two-tailed t test on individual data points). Scale bar, 10 μm if not indicated. The non-targeting control siRNA Pool #2 was abbreviated with siNeg Control or siNeg2. Columns marked as “−” are untransfected cells.

