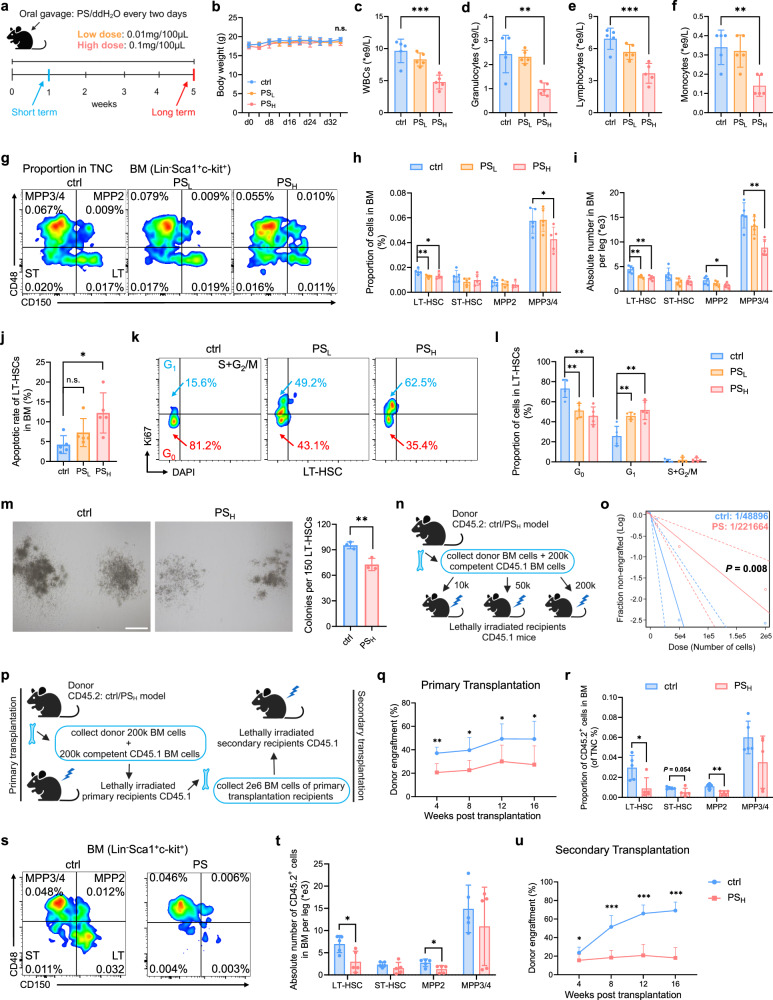
Fig. 1. Long-term ingestion of microplastics results in severe damage to the hematopoietic system.
a Schematic outlining mouse model for MPs-treatment (n = 5 per group). b Body weight of each mouse of the three groups. PSL, 0.01 mg/100 μL; PSH, 0.1 mg/100 μL. c–f Number of white blood cells (WBCs) (c), granulocytes (d), lymphocytes (e) and monocytes (f) in peripheral blood. g Representative flow cytometry images of the LSK compartment (Lin–Sca-1+c-Kit+) showing LT-HSC, ST-HSC, MPP2 and MPP3/4 population frequencies within total bone marrow (BM). h, i Proportion of cells in BM (h) and absolute cell number in BM (i). j Apoptosis in LT-HSCs. Representative flow cytometry images of cell cycle distribution (k) and proportion of cells synchronized at the G0, G1 and S + G2/M phases (l) within LT-HSCs. m Representative images of CFUs seen after 8 days of ctrl or PSH LT-HSC culture (scale bar, 500 μm) (left) and statistical data (right) (n = 3 per group). n Experimental schema of limiting dilution analysis (LDA) in vivo. o Functional HSC frequency determined by LDA at 16 weeks post transplantation (n = 6 per group). Dashed lines show 95% confidence intervals. p Experimental schema of primary and secondary transplantation (n = 5 per group). q Donor peripheral-blood chimerism of recipient CD45.1 mice in primary transplantation. r, s Proportion (r) and representative flow cytometry images (s) of CD45.2+ cells in BM from primary transplantation recipient mice. t Absolute number of CD45.2+ cells in BM. u Donor peripheral-blood chimerism in secondary transplantation. Each symbol represents an individual mouse. Data are shown as the mean ± SD, unpaired two-tailed t-test, *P < 0.05, **P < 0.01, ***P < 0.001, n.s., not significant.

