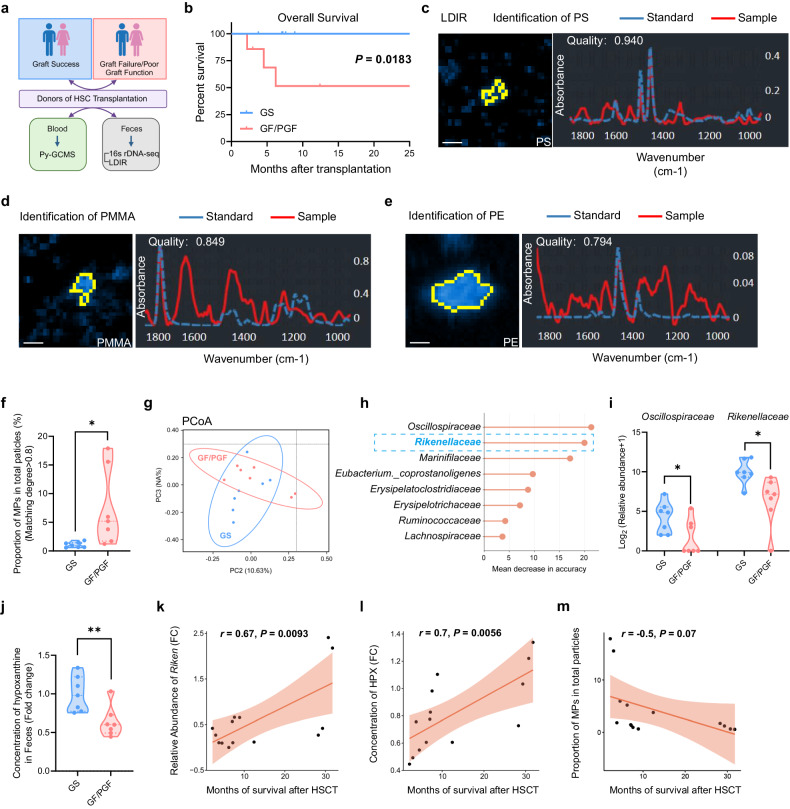
Fig. 6. Microplastics and gut microbiota in donors are significantly associated with outcome of HSCT in patients.
a Scheme of the method to collect patient samples and detect relevant indicators (graft success (GS): 7 patients; graft failure/poor graft function (GF/PGF): 7 patients). b Survival rate of patients after BM transplantation. c–e Representative images of MPs in feces through laser direct infrared imaging (LDIR). Picture (left), definition curve (right); identification of PS (c), PMMA (d) and PE (e). Scale bars, 30 μm. f Relative quantification of MPs in feces. g PCoA of 16s rDNA in feces. h Random Forest (RF) analysis of feces in two groups. i Relative abundance of Oscillospiraceae and Rikenellaceae in feces. j Concentration of hypoxanthine in feces. k–m Correlation between survival rate after BMT and relative abundance of Rikenellaceae (k), concentration of hypoxanthine (l) or proportion of MPs in feces (m). The Pearson correlation coefficient (r) and empirical P value are also shown. Error bars indicate SD, unpaired two-tailed t-test. *P < 0.05, **P < 0.01.

