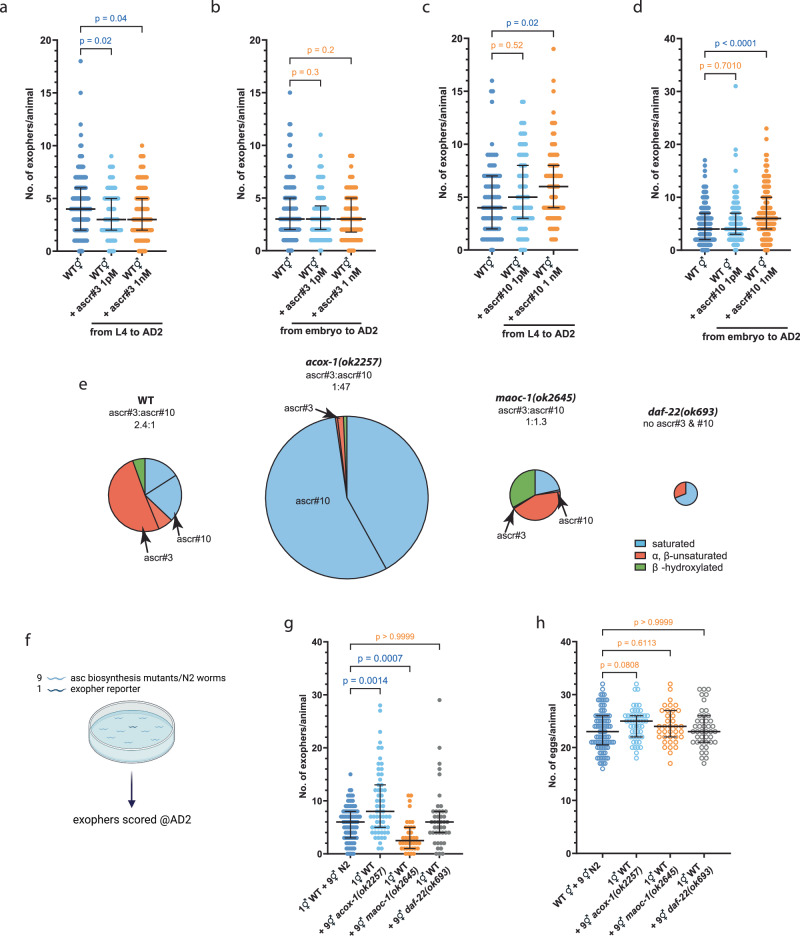
Fig. 3. The production of exophers by hermaphrodites is inhibited by ascr#3 and stimulated by ascr#10 pheromones.
a Hermaphrodites cultured from L4 to AD2 on NGM plates with 1 pM or 1 nM ascr#3 showed reduced exopher production. n = 222, 90, and 119 worms (for respective columns), N = 3 - 6 independent experiments. b Culturing hermaphrodites from embryos to AD2 with 1 pM or 1 nM ascr#3 on NGM plates did not affect exopher production. n = 149, 90, and 90 worms (for respective columns), N = 3 – 5 independent experiments. c Exopher production increased in hermaphrodites raised from L4 to AD2 on NGM plates with 1 nM ascr#10. n = 87, 85, and 79 worms (for respective columns), N = 3 independent experiments. d Raising hermaphrodites from embryos to AD2 on NGM plates with 1 nM ascr#10 led to increased exopher production. n = 190, 173, and 164 worms (for respective columns), N = 5–6 independent experiments. e Mutants deficient in the biosynthesis of short-chain ascarosides exhibit unique ascaroside pheromone profiles, characterized by low levels of ascr#3 and a varying ratio relative to ascr#10. Pie charts are based on the data from25 that were obtained for mixed-stage worm populations. Circle’s diameter denotes the proportion of produced ascarosides relative to wild-type. f Schematic representation of the experimental setup for investigating the influence of ascaroside biosynthesis mutants on exophergenesis level in wild-type worms. Created with BioRender.com. g Growing wild-type hermaphrodites in the presence of acox-1(ok2257) (high ascr#10 levels) and maoc-1(ok2645) (low levels of both ascr#3 and ascr#10) mutants increase and decrease exopher production, respectively. n = 93, 43, 60, and 38 worms (for respective columns), N = 3 independent experiments. h Growing wild-type hermaphrodites with ascaroside biosynthesis mutants does not influence the number of embryos in the uterus. n = 93, 43, 50, and 37 worms (for respective columns), N = 3 independent experiments. Data information: @AD2 means “at adulthood day 2”. Data are presented as median with interquartile range; not significant p values (p > 0.05) are in orange color, significant p values (p < 0.05) are in blue color; Kruskal-Wallis test with Dunn’s multiple comparisons test. Source data are provided as a Source Data file.

