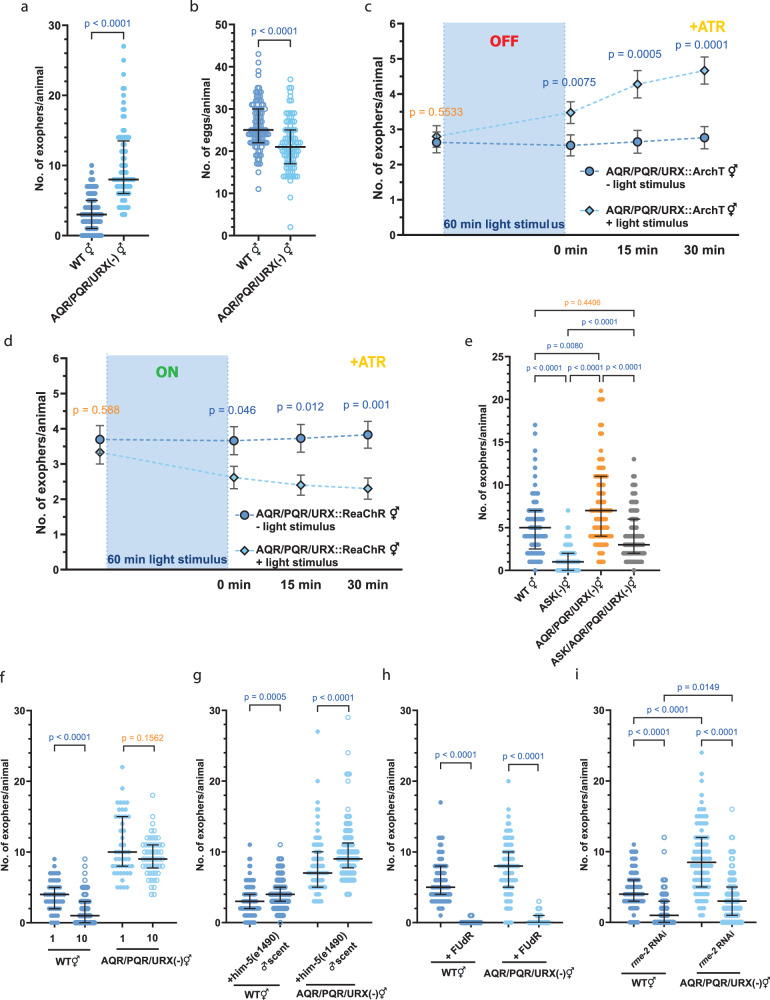
Fig. 6. Pseudocoelom-exposed neurons negatively regulate exopher production.
a Genetic ablation of pseudocoelom-exposed AQR, PQR, and URX neurons increases exopher production. n = 100 and 89 worms (for respective columns), N = 3 independent experiments. b Genetic ablation of pseudocoelom-exposed AQR, PQR, and URX neurons causes a decrease in the number of embryos present in the uterus. n = 100 and 89 worms (for respective columns), N = 3 independent experiments. c ArchT-mediated optogenetic inactivation of AQR, PQR, and URX neurons increases exopher production. n = 59 worms, N = 6 independent experiments. d ReaChR-mediated optogenetic activation of AQR, PQR, and URX neurons decreases exopher production. n = 59 worms (- light stimulus), 60 worms ( + light stimulus); N = 6 independent experiments. e The opposing exophergenesis levels observed in animals with genetic ablation of ASK neurons (low exophergenesis) and AQR, PQR, and URX neurons (high exophergenesis) converge to an intermediate level in animals with all four neurons removed. n = 89, 90, 95, and 90 worms (for respective columns), N = 3 independent experiments. f Decreased exophergenesis levels due to exposure to hermaphrodite pheromones are partially mediated by AQR, PQR, and/or URX neurons. n = 51, 60, 48, and 54 worms (for respective columns), N = 3 independent experiments. g Increase in exophergenesis levels due to exposure to male pheromones is not altered in animals with genetic ablation of AQR, PQR, and URX neurons. n = 103, 105, 102, and 102 worms (for respective columns), N = 3 independent experiments. h Genetic ablation of AQR, PQR, and URX neurons does not rescue the inhibition of exophergenesis caused by FUdR-mediated worm sterility. n = 90, 89, 89, and 90 worms (for respective columns), N = 3 independent experiments. i Genetic ablation of AQR, PQR, and URX neurons only partially rescues the inhibition of exophergenesis caused by rme-2 (yolk receptor) knockdown. n = 90 worms, N = 3 independent experiments. Data information: +ATR means “with all-trans-retinal”. Data are presented as median with interquartile range (a, b, e–i) or mean with SEM (c–d); not significant p values (p > 0.05) are in orange color, significant p values (p < 0.05) are in blue color; (a–d, f–h) two-tailed Mann–Whitney test, (e–i) Kruskal–Wallis test with Dunn’s multiple comparisons test. Source data are provided as a Source Data file.

