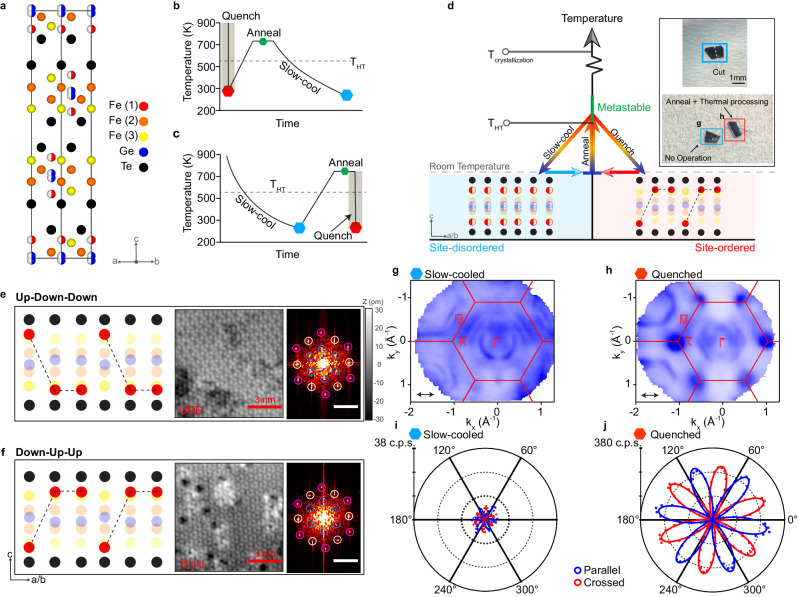
Fig. 1. Phase tuning in Fe5−δGeTe2.
a Crystal structure of Fe5GeTe2 with atomic sites labeled. Fe(1) and Ge are modeled as split sites, marked by half-filled circles to represent 50% occupancy. b–d Schematic and procedures for tuning global symmetry via sublattice ordering. The two quantum phases can be switched by first annealing to above THT = 550 K and either quenching or slowly cooling to achieve the site-ordered phase or the site-disordered phase, respectively. The inset in d show the real steps of tuning phases. e–f Schematic model and STM topographic image of the superstructure on Te termination. The right panels are Fourier transforms of the respective topographies with peaks corresponding to the lattice periodicity (white), a superstructure periodicity (blue), and the second order of the superstructure periodicity (pink). The inset scale bars are 17.3 nm−1. The schematic lattice in e corresponds to an up–down–down (UDD) ordering of the Fe(1) atoms while that in f corresponds to a down–up–up (DUU) ordering of the Fe(1) sites. g–h The Fermi surfaces of the two phases were measured at 15 K using 114 eV LV photons, achieved by slow-cooling the crystal to room temperature from above THT (g) and quenching from above THT (h), respectively. The arrows indicate the photon polarization direction. i, j Polarization-resolved SHG intensity on slow-cooled and quenched crystals measured at 5K. In both figures, the crossed and parallel configurations correspond to E(2ω) ⊥ E(ω) and E(2ω) ∣∣ E(ω), respectively, while E(2ω) and E(ω) were simultaneously rotated in the crystal ab-plane. c.p.s. stands for counts per second. The dots are experimental data and the solid curves are the fits by a sixfold sinusoidal function.

