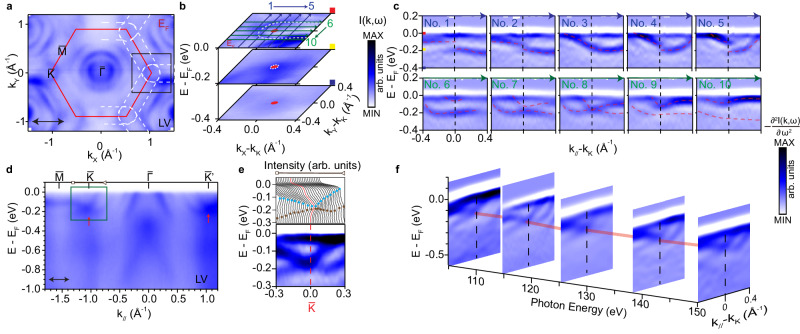
Fig. 2. Topological nodal lines in the slow-cooled site-disordered phase.
a Fermi surface mapping with LV polarized photons. The red line outlines the 2D BZ boundary and the white dashed line marks the electron pocket surrounding the BZ boundary. b Zoomed in view of the box in (a). c Dispersions measured across the Dirac node, showing the crossing bands and the opening of a gap away from the Dirac node. d Dispersions measured along the ––– direction with LV polarization. The red arrows in (d) point to the Dirac crossings. e Energy distribution curves (EDCs) and the second energy derivative cut within the momentum range marked by the black arrow in (d). f Photon energy dependence of the cut near the point. The red solid line shows the Dirac nodal line along kz. All data from a–e were taken with 132 eV photons.

