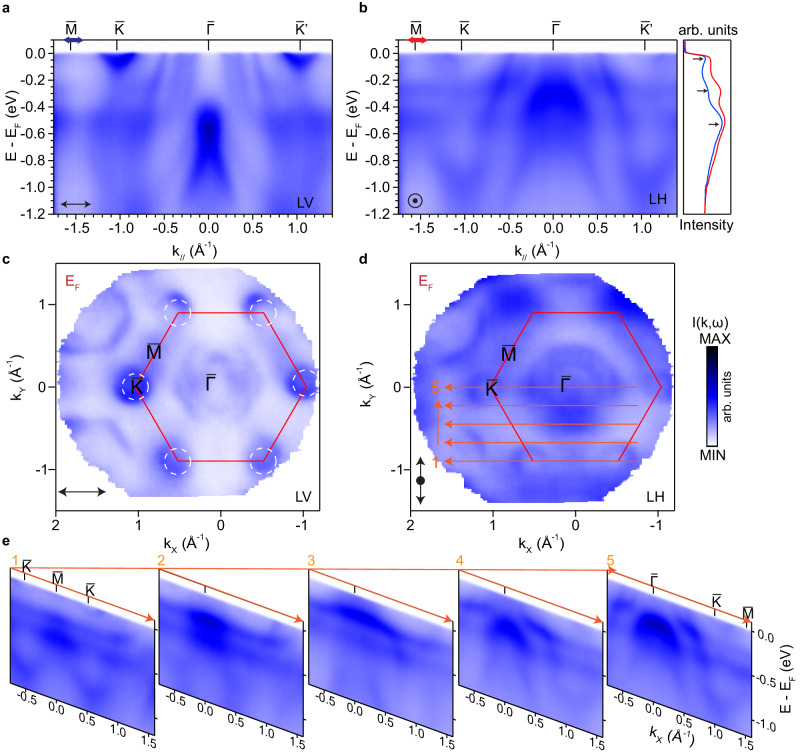
Fig. 3. Flat bands in the quenched site-ordered phase.
a, b Measured energy-momentum dispersions along the ––– direction with LV and LH polarized photons. The EDCs are integrated from a small range around marked by the arrows in (a, b), showing three peaks that correspond to the location of the flat bands. c, d Corresponding Fermi surfaces measured with LV and LH polarizations, respectively. Data in c were measured under the same geometry as (b). e Measured dispersions along a series of parallel cuts within the first BZ as shown in (d). All data from a–e were taken with 114 eV photons.

