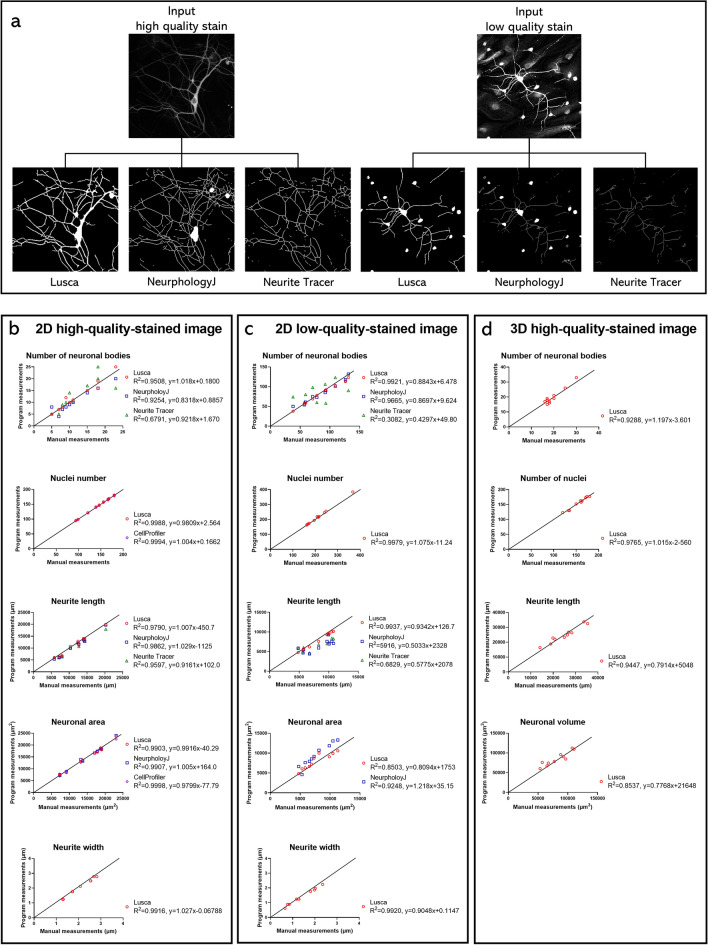
Figure 2.
Qualitative and quantitative comparison of different scripts for neuron analysis with Lusca and manual tracing on 2D high and low-quality-stained and 3D images. Comparison between open-source programs, Lusca, and manual tracing performed on MAP2 high and low-quality-stained input images. (a) Qualitative comparison of Lusca, NeurphologyJ, and Neurite Tracer final output images for each image stain quality. Datasets (neuronal bodies and nuclear count, neurite length and width, and neuron area/volume) generated by each open-source program, Lusca and manual measurements subjected to linear regression for 2D (b) high and (c) low-quality-stained images, as well as (d) 3D images. The equations for the lines of best fit and the coefficients of determination are presented in the figure key.

