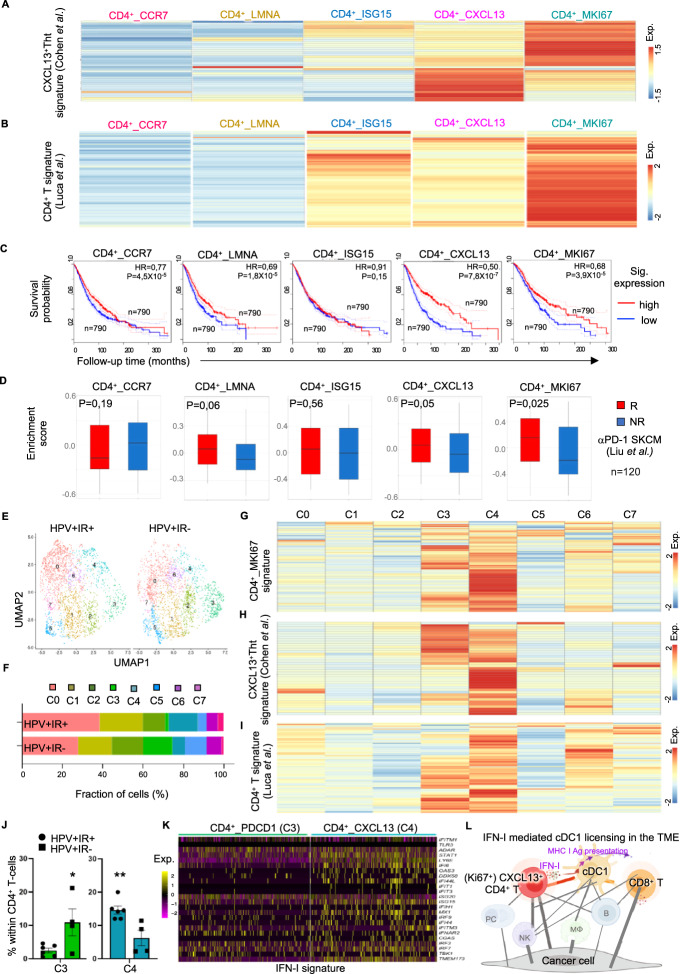
Fig. 8.
Tumor-infiltrating Ki67+CXCL13+CD4+ T cells enriched with the IFN-I signature are associated with better clinical outcomes in cancer patients. Tumor-infiltrating Ki67+CXCL13+CD4+ T cells enriched with the IFN-I signature are associated with better clinical outcomes in cancer patients. A, B Heatmaps depicting the average expression values of signature genes of the A CXCL13+ T-helper tumor-specific cell (Tht) signature [40] and the B tumor-infiltrating CD4+ T cells in CE9 [19] in the five tumor-infiltrating FOXP3-CD4+ T-cell clusters that we identified. C Kaplan–Meier curves revealing the prognostic value of the tumor-infiltrating CD4+ T-cell clusters that we identified for overall patient survival in the BRCA, COAD, LIHC, LUAD, OV, READ and SKCM cohorts from the TCGA database (n = 3156). The high and low metagene expression subgroups of patients were identified based on a threshold of the quartile expression level. D Box plots depicting the enrichment scores of tumor-infiltrating CD4+ T-cell clusters in responders (R) and nonresponders (NR) to anti-PD-1 immunotherapy [42]. E–K ScRNAseq data of tumor-infiltrating FOXP3−CD4+ T cells from HPV+ OPSCC patients (n = 43) were analyzed. The patients were stratified into the immune response-positive (IR+, n = 6) and immune response-negative (IR−, n = 4) groups based on the presence or absence, respectively, of tumor-specific T-cell infiltration. E, F UMAP plot and compositions of the eight clusters identified in the IR+ and IR− groups. Heatmaps depicting the average expression values of G the tumor-infiltrating CD4+_MKI67 signature that we identified, H the CXCL13+ Tht signature [40] and (I) the tumor-infiltrating CD4+ T-cell signature in CE9 [19] in each cluster. J Percentages of cluster 3 and 4 cells among CD4+ T-cells from patients in the IR+ and IR− groups. K Heatmaps depicting the expression of the IFN-I signature in tumor-infiltrating CD4+ T cells in clusters 3 and 4. L Schematic illustration depicting the mechanism of cDC1 licensing mediated by IFN-I-producing CXCL13+CD4+ T cells in the proinflammatory TME (CE9) [19]. P < 0.05*, P < 0.01** (log-rank test/Mantel–Cox test in C; Mann–Whitney U-test for J). The data are shown as the means ± SEM

