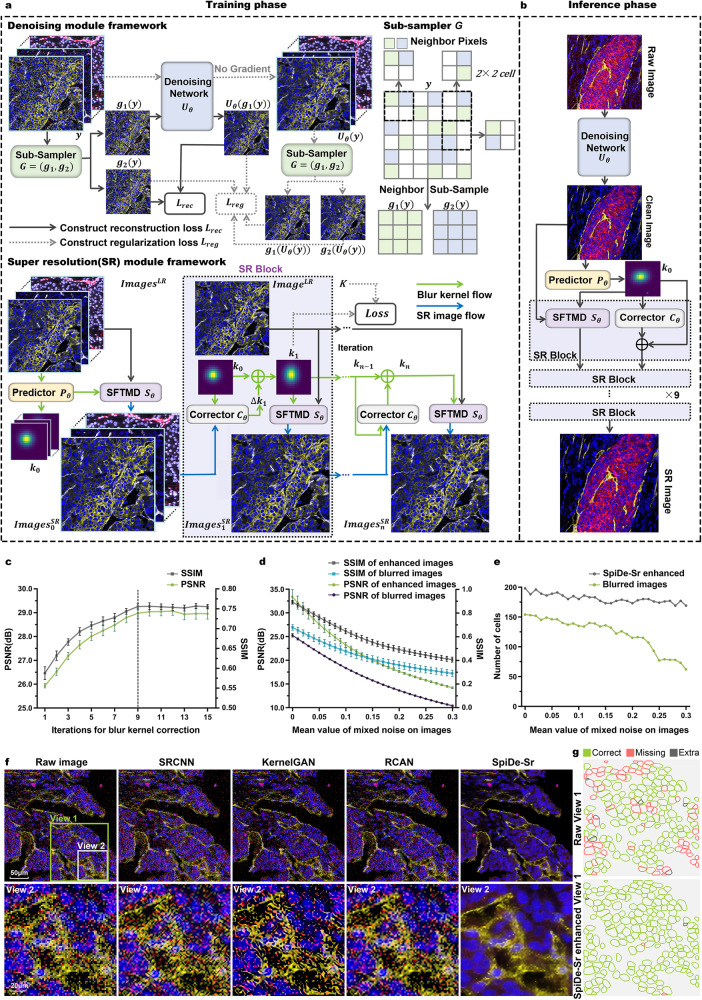
Fig. 1. SpiDe-Sr method.
a The architecture of SpiDe-Sr. The network was comprised of the denoising module and the super-resolution module. The denoising module included the neighbor sub-sampler and the U-net denoising network. And the super-resolution module had three components: the blur kernel predictor (), the blur kernel corrector () and the image super-resolution network (). b Inference using the trained SpiDe-Sr network. The architectural details and interpretability of the SpiDe-Sr were illustrated in Supplementary Fig. 1 and Supplementary Fig. 2. c Quantitative evaluation of SR image quality with different iterations of blur kernel estimation. Dashed line indicated the optimal number of iterations. n = 4392 images. d Quantitative evaluation of image PSNR and SSIM with different noise levels before and after the SpiDe-Sr enhancement. n = 4392 images. PSNR, peak signal-to-noise ratio, larger means less noise. SSIM, structural similarity, larger means more similar to the ground truth. In (c, d), data were mean ± SD. e The number of cells extracted based on images with different noise levels before and after the SpiDe-Sr enhancement. Total number of cells in the field of view was 200. f Visual comparison of SpiDe-Sr method with the three state-of-the-art (SOTA) super-resolution methods including SRCNN, KernelGAN, and RCAN. g Spatial profiles of extracted cells in the field of View 1. Correctly segmented regions (true positives) were colored in green. Missing (false negatives) and extra regions (false positives) were colored in red and gray, respectively. All cell segmentation tasks in our work were implemented with the Cellpose algorithm. Source data are provided as a Source data file.

